
Explore the World of Jellydator
Discover in-depth tutorials and insightful articles to help you make the most of the Jellydator platform

Building Smart Dollar-Cost Averaging (DCA) Strategies using Crypto Fear & Greed, RSI and Sentiment Analysis
Discover how to upgrade DCA strategies by integrating technical indicators and sentiment analysis. Use tools like Crypto Fear & Greed, RSI, and Reddit sentiment to make your automated crypto investments smarter, more flexible, and responsive to market changes.

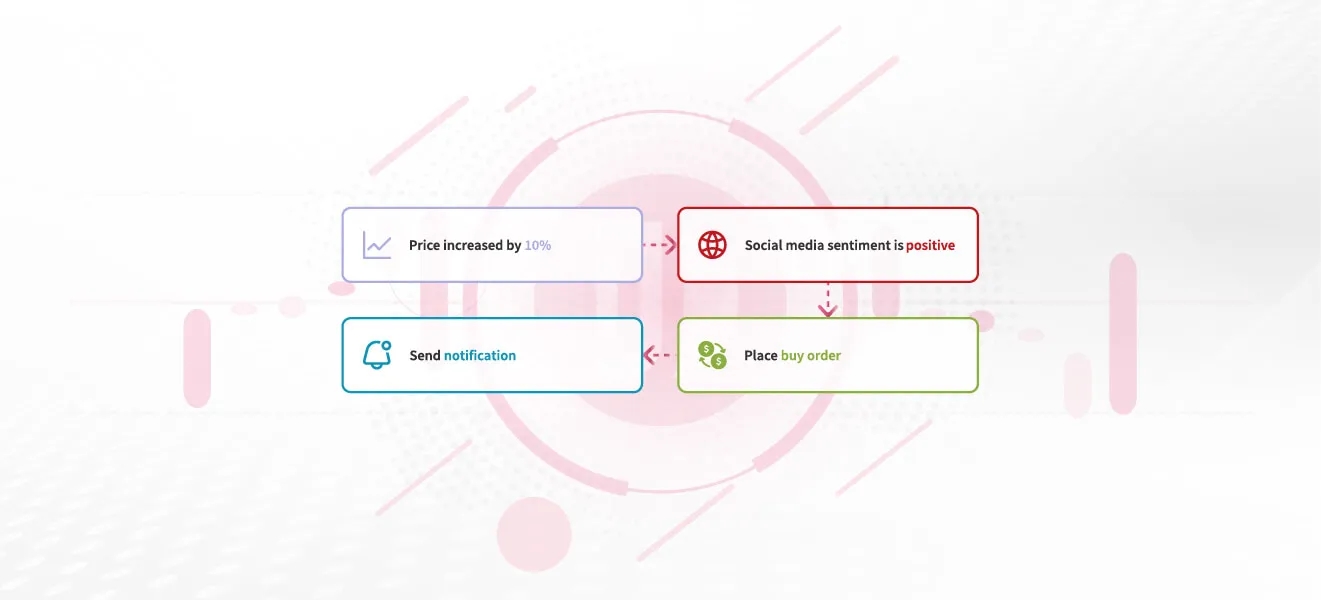
Top 5 Crypto Automation and Trading Bot Use Cases
Discover how crypto automation and trading bots can revolutionize your strategy. Learn five top uses, from technical analysis and sentiment tracking to instant notifications and automated risk controls, for smarter, swifter trades in today’s fast-paced crypto market.

The Problem with Automated Trading Bots
Trading bots aren’t money machines. This blog explains their real role as decision-making helpers, warns against unrealistic promises, and highlights the importance of control and caution in automated trading.

Power Up Your Crypto DCA with Custom Schedules
Say goodbye to rigid DCA options! This tutorial shows how to use Jellydator’s Date & Time step to create truly custom crypto investment schedules, automate buy actions, and build a flexible, easy-to-manage DCA strategy tailored to your evolving financial objectives.

Crypto Trading Bots Are Getting Smarter — Here’s What’s Changing
Crypto trading bots are advancing, but success depends on more than automation. This post explains why intuitive design, transparent analytics, and AI-powered insights are crucial — and how Jellydator is setting a new standard for digital asset trading platforms.

How to Get Real-Time Bitcoin Search Alerts on Telegram
Get notified instantly when Bitcoin search trends spike. This guide walks you through automating Google Trends monitoring and Telegram alerts with Jellydator, so you’re always ready for the next wave of crypto volatility.

Why Traders Fail in Bull & Bear Markets (And How to Succeed)
Bull or bear, markets test traders’ discipline and strategy. Find out why so many fail, the psychological traps to avoid, and how you can prepare for success in any market environment.
How to Build a Crypto Trading Bot That Works
Should you code your own trading bot, use an exchange tool, try a third-party platform, or go visual with Jellydator? We compare all four to help you pick the right path for your trading automation journey.

Practical Guide to the Golden Cross/Death Cross Strategy
This step-by-step guide walks you through setting up a Golden Cross and Death Cross strategy, helping you use moving average crossovers to identify potential trend shifts and manage entries as well as exits safely.

How to Connect Your OKX Account to Jellydator
Discover how to link your OKX account to Jellydator for streamlined trading, asset tracking, and advanced market insights. Follow this easy, step-by-step guide to get started in just a few minutes.

Designing Your Own Sweet Chariot Strategy
Sweet Chariot is a beginner-friendly, reliable trading strategy based on a 40-period SMA. This guide shows you how to build it on Jellydator, block duplicate trades, manage balances, and set up real-time Telegram notifications.

How to Connect Your KuCoin Account to Jellydator
Link KuCoin to Jellydator in just a few clicks. Our guide covers everything from API key creation to IP whitelisting, letting you access exclusive analytics and manage your crypto portfolio effortlessly.
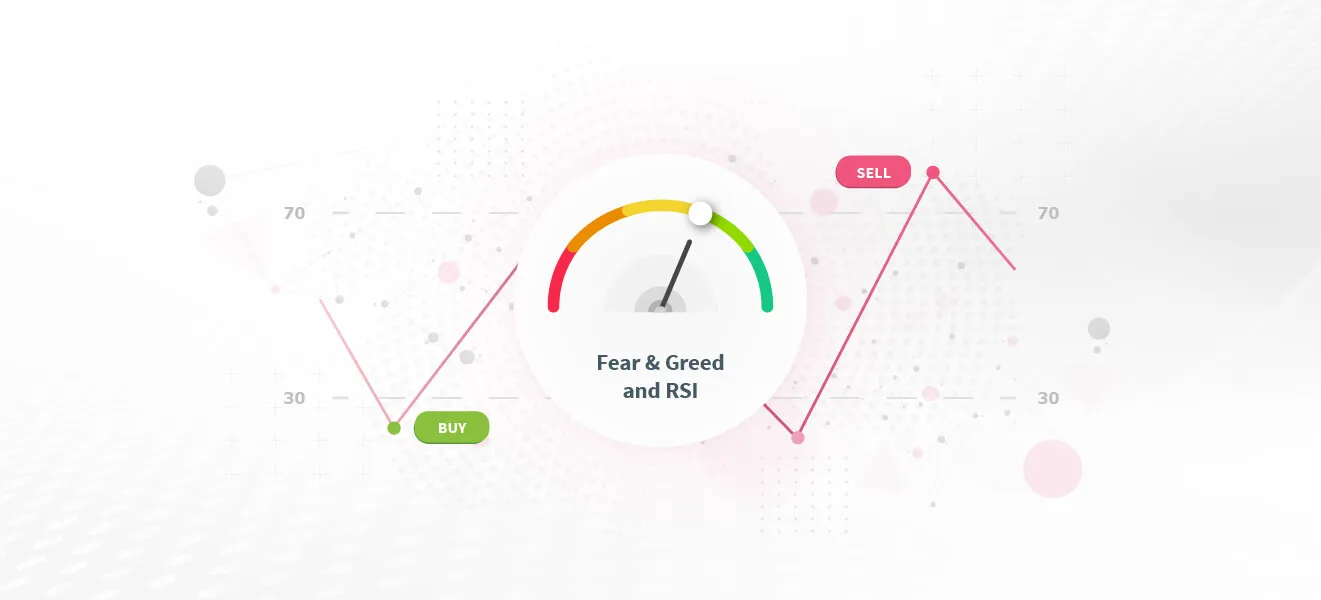
Contrarian Trading Using Crypto Fear & Greed and RSI Indicators
This guide shows you how to create a contrarian trading strategy with Jellydator, combining the Crypto Fear & Greed Index and RSI. It includes step-by-step setup, order management, and real-time Telegram alerts.

How to Connect Your Coinbase Account to Jellydator
Connect Coinbase to Jellydator in minutes. This guide shows you how to set up API keys, whitelist IPs, and unlock powerful trading features and analytics for smarter crypto decisions.

How to Connect Your Bitget Account to Jellydator
Learn how to connect your Bitget account to Jellydator and gain access to powerful analytics, technical indicators, and real-time sentiment tracking. This guide makes the integration process simple and secure.

Building a Bollinger Bands Reversal Strategy
Learn how to build a Bollinger Bands trading strategy with Jellydator. This guide covers setup, buy/sell conditions, and risk management tips to help you trade confidently in volatile markets.

How to Connect Your Binance Account to Jellydator
Learn how to connect your Binance account to Jellydator in a few easy steps. Unlock advanced trading insights and take control of your crypto portfolio like never before.

Google Trends & Crypto FOMO: Identifying Buying Pressure Through Search Data
Explore the connection between Google Trends and cryptocurrency prices. Learn how search interest impacts market sentiment, discover time-lag patterns, and implement automated strategies with Jellydator to stay ahead in the dynamic world of cryptocurrency trading.

Dollar-Cost Averaging (DCA) in Crypto: A Strategy for Volatile Times
Is Dollar-Cost Averaging (DCA) the best way to invest in crypto? Find out how it works, why it’s popular, and how tools like Jellydator enhance this strategy with advanced flexibility.

The Rise of Crypto ETFs: What They Mean for Bitcoin, Ethereum, and You
Crypto ETFs are changing the game! Understand their role in making Bitcoin and Ethereum accessible, driving demand, and stabilizing markets. Learn to track ETF trends with Jellydator to stay ahead in the fast-paced world of crypto investing.

How to Link Your Telegram Account To Jellydator
Make trading easier by linking Telegram to Jellydator. Follow this guide to unlock features like notifications and group message tracking.

How to Test Your Strategies Safely
Master safe automated trading strategy testing with Jellydator’s paper exchanges. Simulate trades using artificial funds, gain hands-on experience, and refine decision-making skills—all risk-free.

5 Tips for Building an Effective Automated Trading Strategy
Optimize your Jellydator trading strategies with five key tips: limit execution frequency, create branching paths, consolidate asset management, avoid redundant steps, and ensure smooth operations with balance checks.

Automated Strategy Building 101
Streamline your trading with the Jellydator automated strategy editor. This guide covers the use of strategy steps and special operators to create dynamic workflows that automate market analysis and improve decision-making.

About Us: The Vision and Future of Jellydator
Jellydator was created to bridge gaps in market analysis tools—offering ease of use, diverse integrations, and transparency. Learn how our journey from a pandemic experiment led to innovative solutions empowering traders across crypto markets and beyond.