
Bollinger Bands are among the most popular and versatile tools in technical analysis. They help traders gauge market behavior and price volatility at specific moments, offering clear visual cues on a chart. With simple rules and intuitive presentation, they are especially appealing to those just starting out in trading.
The concept is straightforward: Bollinger Bands use an upper and lower band to reflect price volatility around a moving average. When the bands narrow, it indicates reduced market activity, while wider bands suggest increased volatility. During extended periods of steady movement, prices may fluctuate within the range of the bands, creating a channel-like pattern. These bands also help traders identify potential support and resistance levels, making them useful for spotting overbought or oversold conditions of an asset.
One effective strategy built around Bollinger Bands focuses on mean reversion—the tendency for prices to return to their average after deviating significantly. In this guide, we’ll show you how to create such a strategy: it’s goal will be to track price movements relative to the bands and place buy or sell orders accordingly. To enhance this further, we’ll include features like balance safety checks and order notifications for improved risk management.
Before we begin, if you’d prefer to skip the process of creating this strategy manually, you can use a prebuilt strategy template instead.
How This Strategy Works
As established earlier, Bollinger Bands are designed to highlight when an asset’s price moves significantly away from its average, creating opportunities for trading. Our strategy builds on that principle by using the bands to identify key moments for buying and selling. When the price falls below the lower band, we’ll use that as an indication to buy, expecting the price to eventually rise to the average. Similarly, when the price moves above the upper band, we’ll see it as a signal to sell, anticipating a reversion back toward the average.
The average price—commonly called the middle band—forms the foundation of this strategy. Its configuration involves setting two parameters: the moving average type and its length (the number of calculation periods). Jellydator simplifies this process by using sensible defaults: a 20-period Simple Moving Average (SMA) that balances responsiveness and reliability. However, while these settings work well in most situations, you can still adjust them. For example, using shorter lengths makes the strategy react faster to price changes, whereas longer lengths smooth out volatility for a steadier approach.
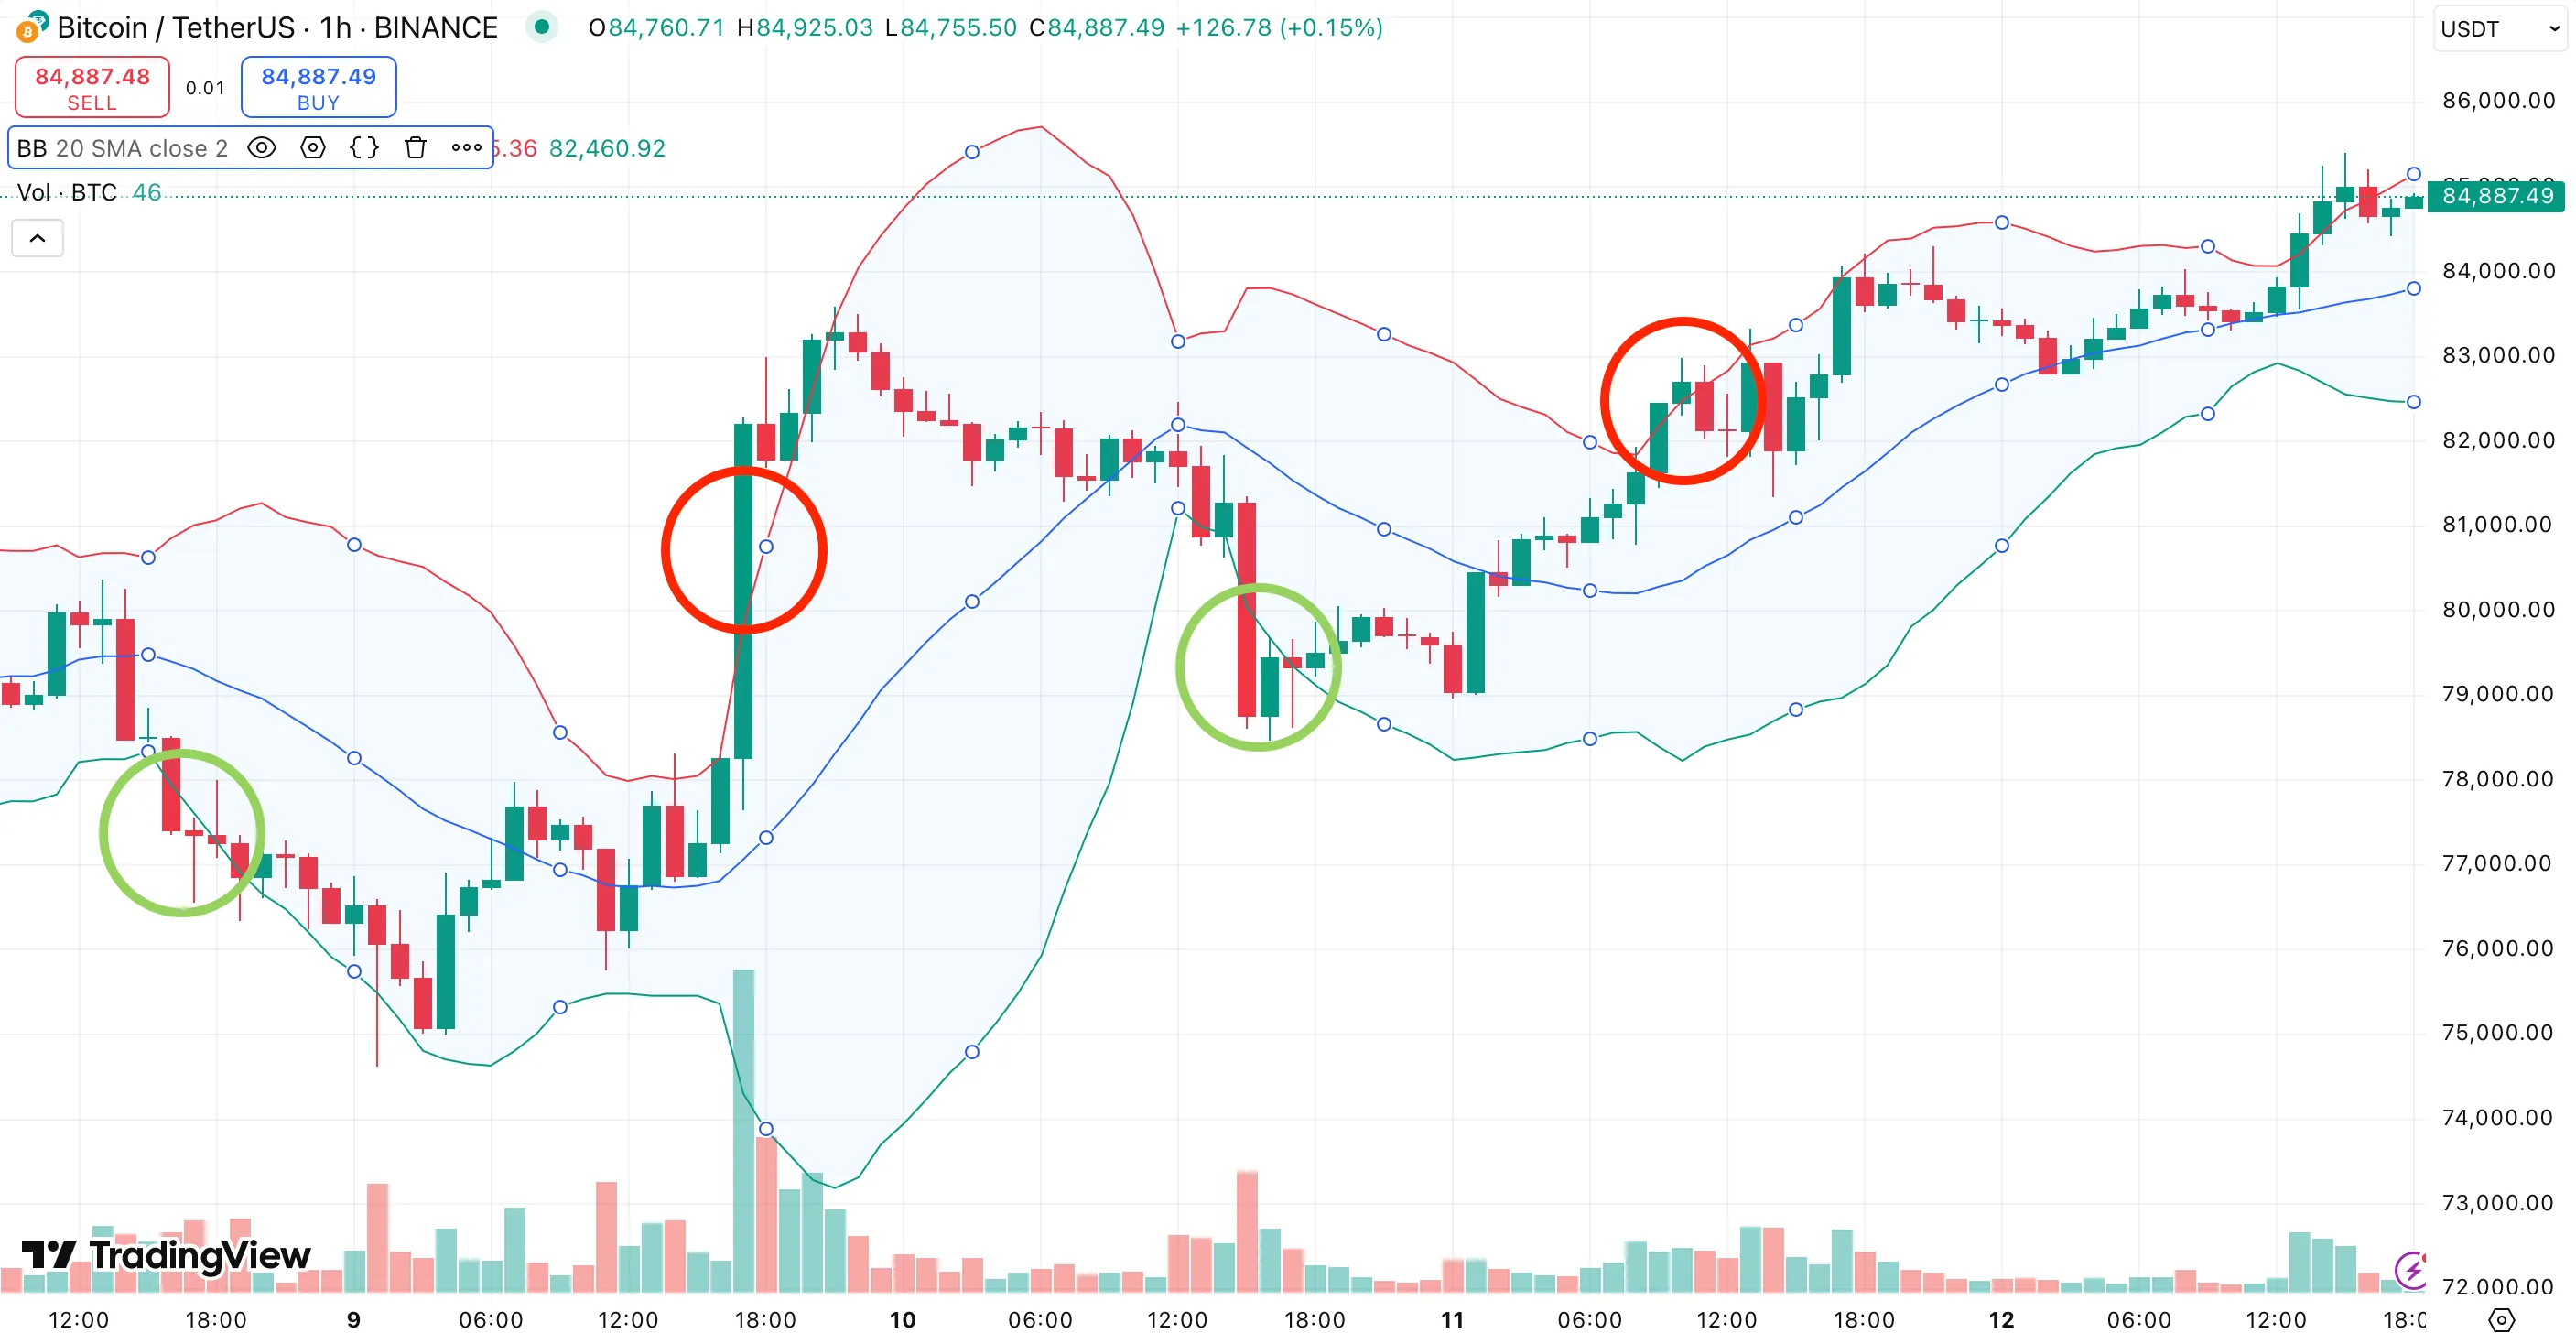
The example below shows a BTC/USDT chart with Bollinger Bands applied. Green markers highlight buy signals where prices dropped below the lower band, while red markers indicate sell signals where prices rose above the upper band.
How to Build It on Jellydator
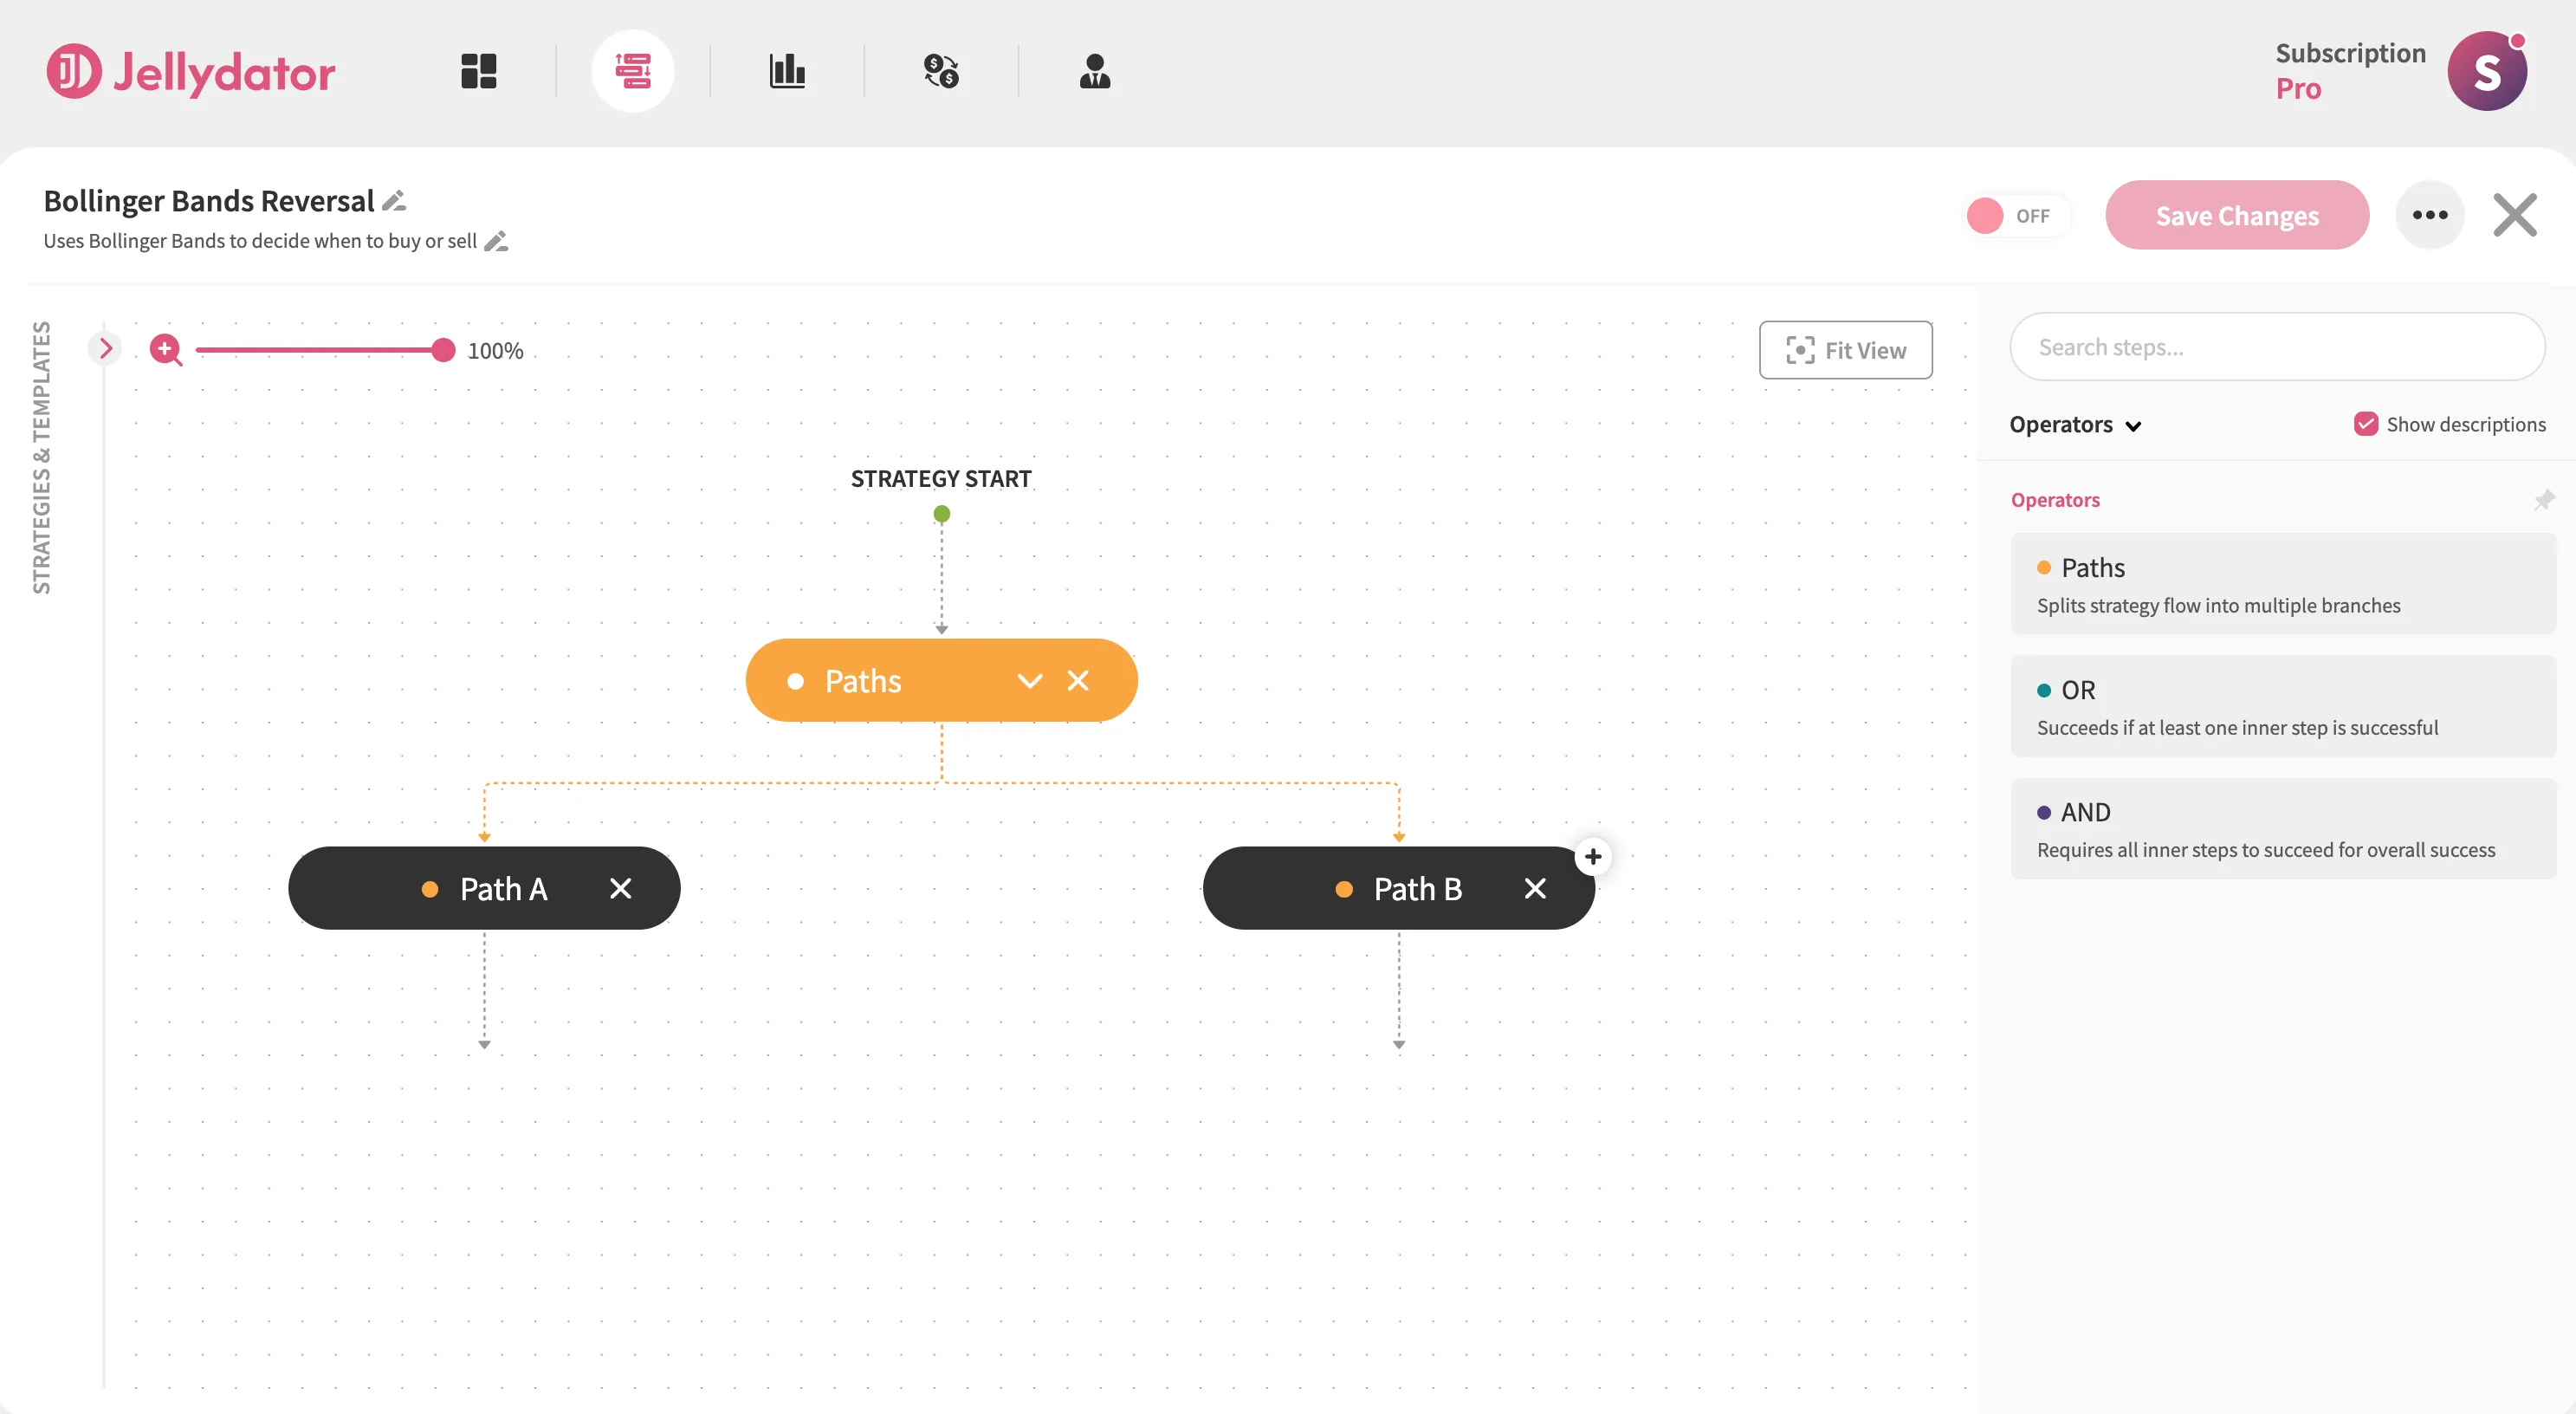
Start by adding a Paths step to your Jellydator editor. This creates two parallel decision paths for your strategy.
Path A Configuration
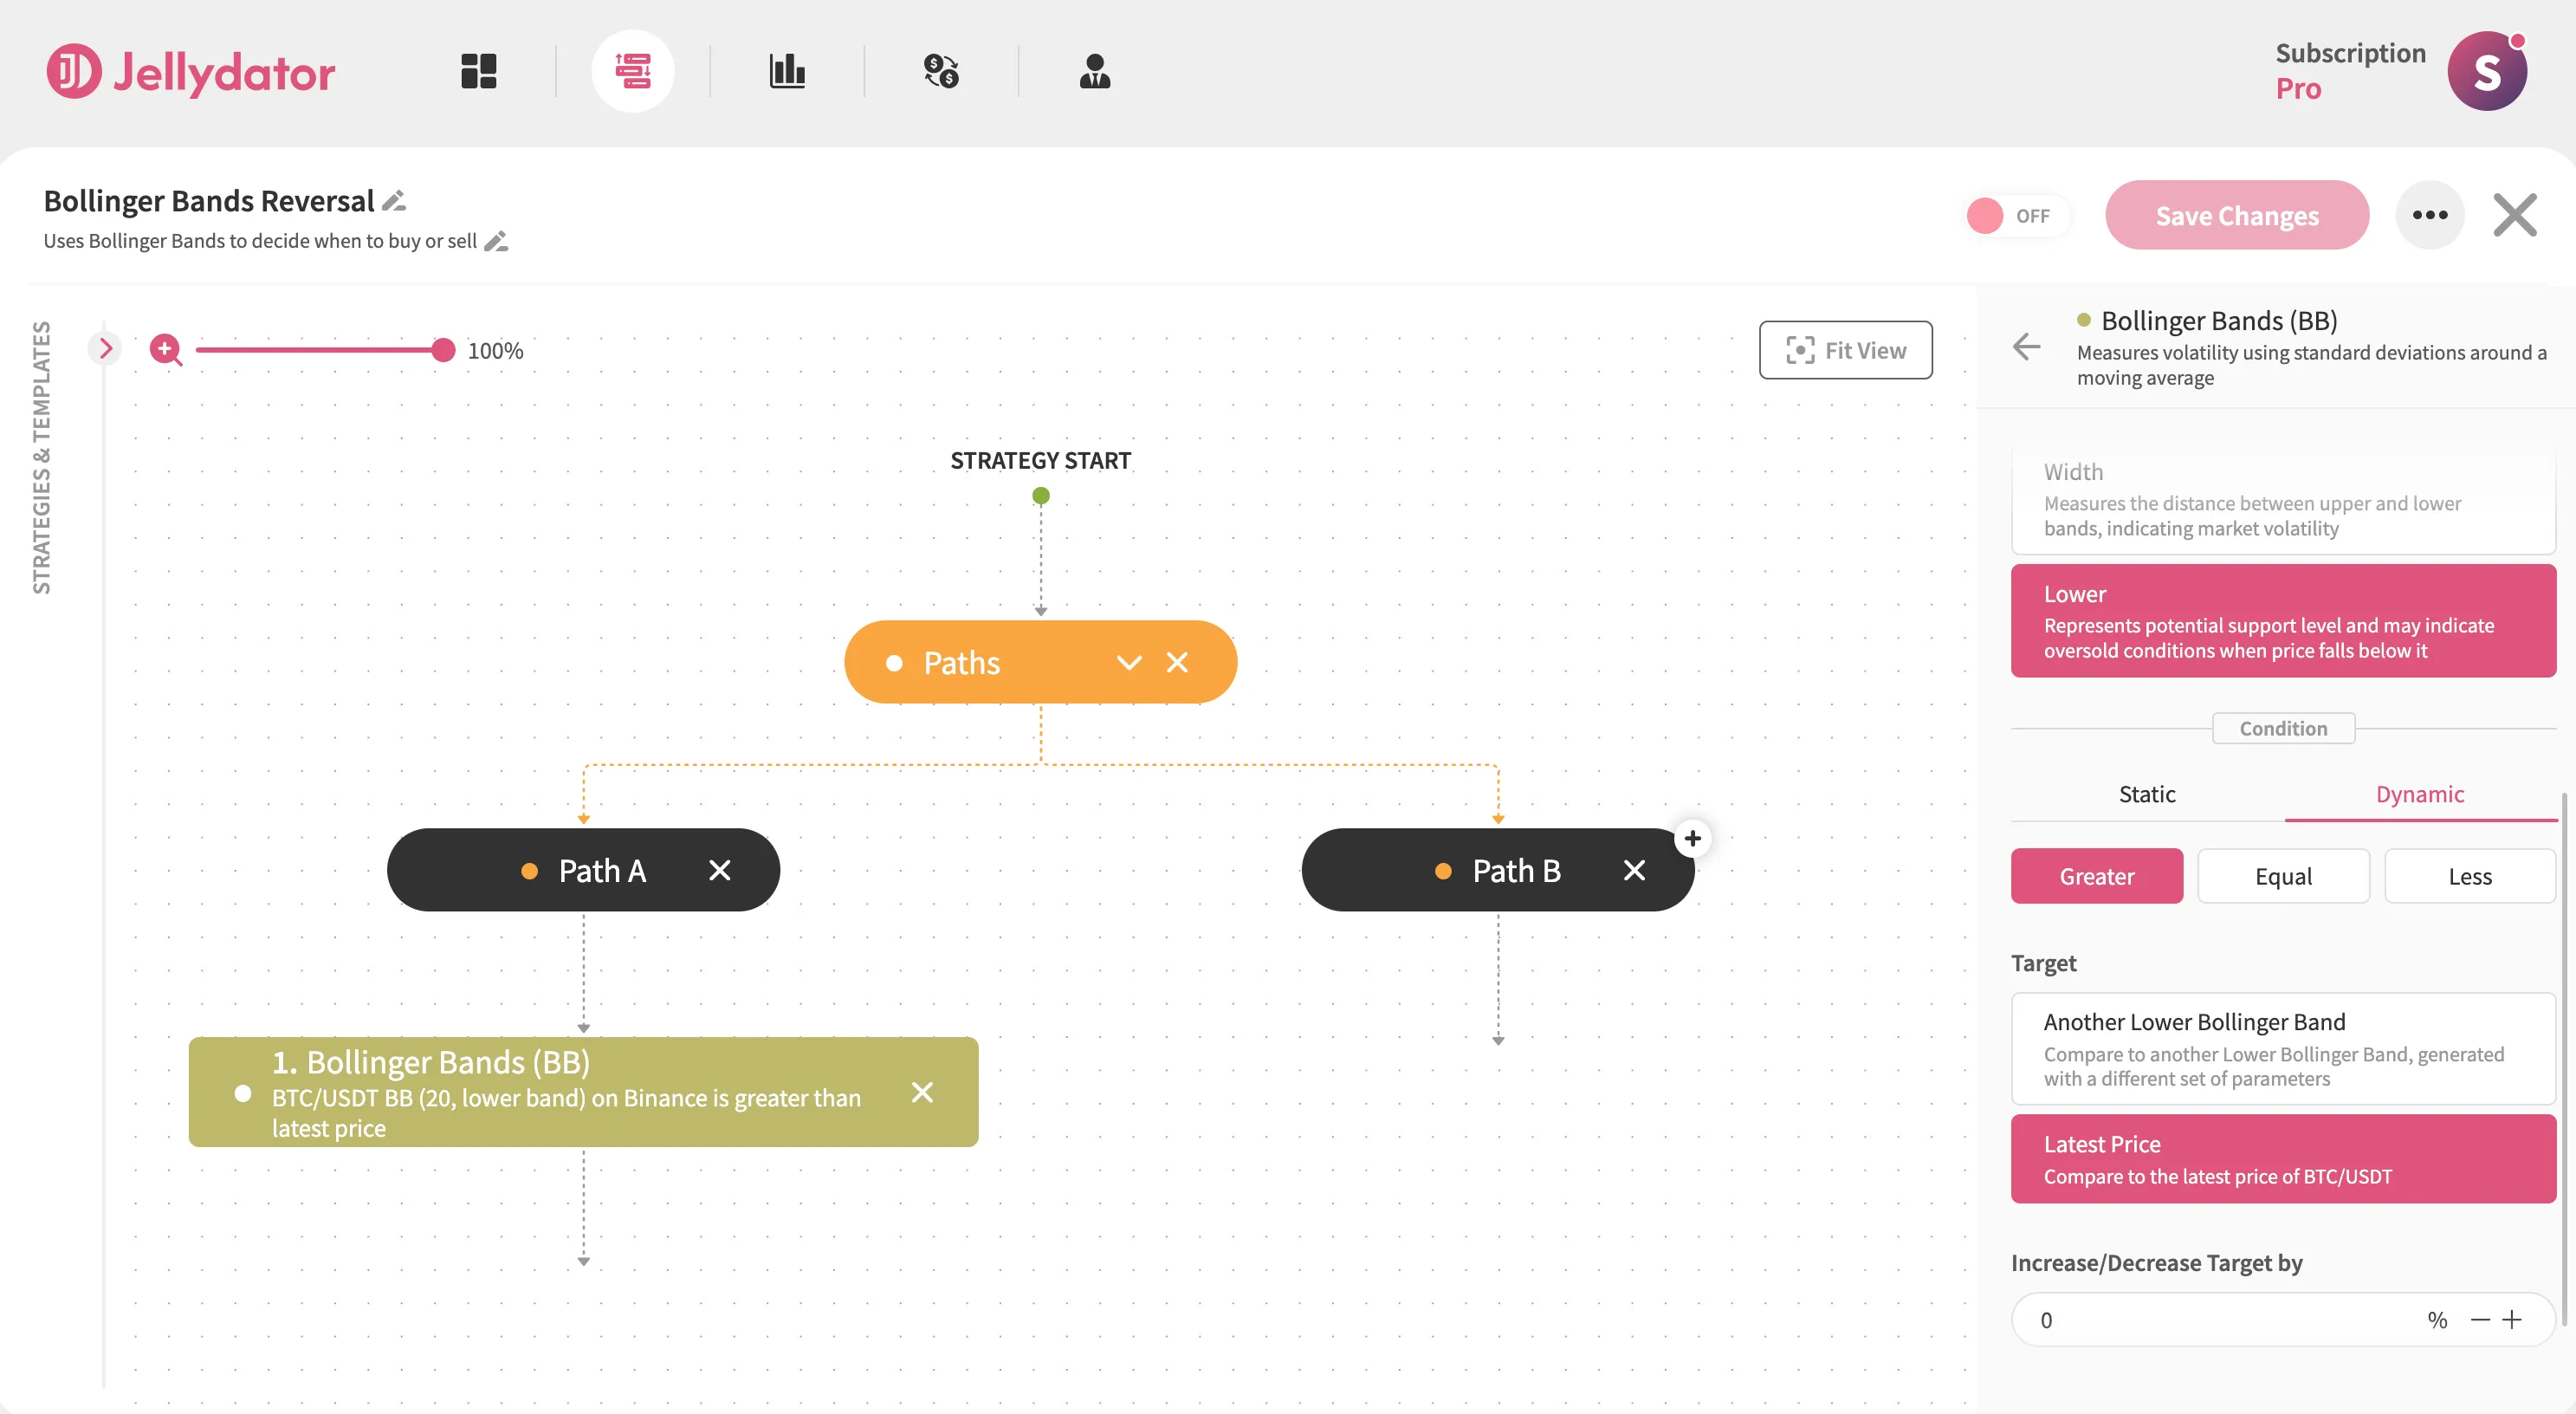
In Path A, add a Bollinger Bands step and select it to open the configuration panel. Ensure the indicator calculates and uses the lower band for your target asset (we’ll use BTC/USDT in this guide). Then, select the 15-minute candle interval.
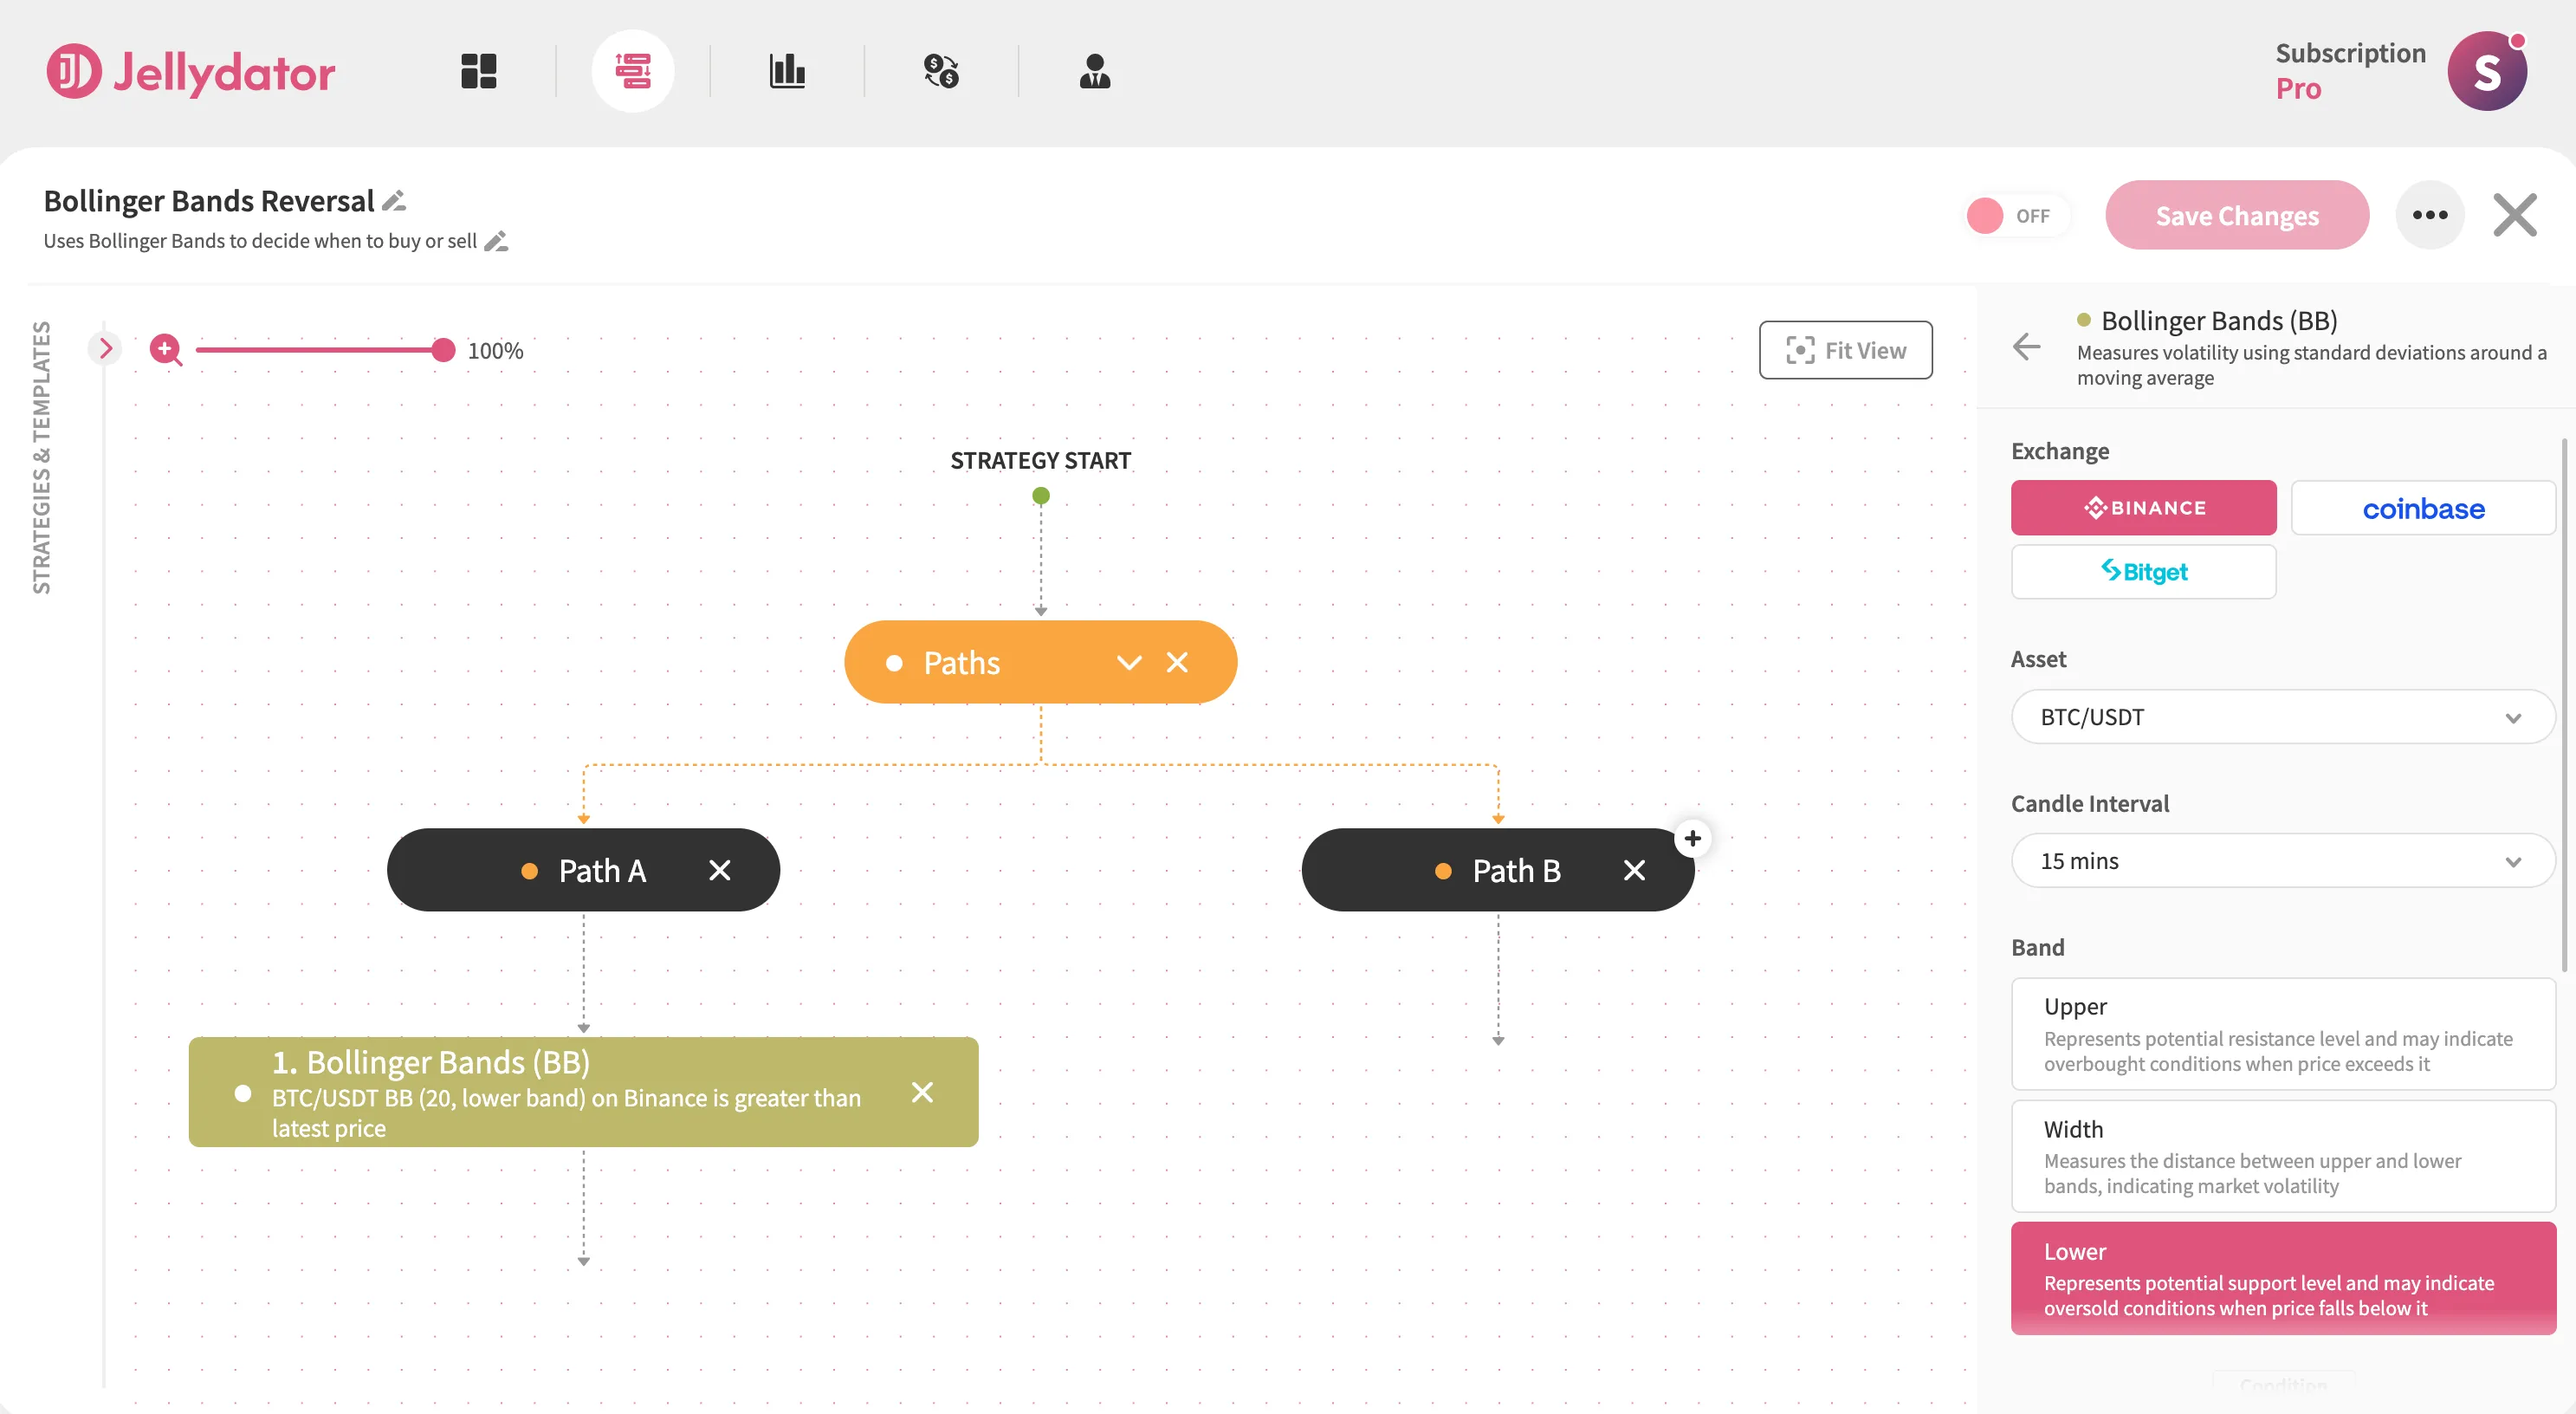
Scroll to the “Condition” section, choose the “Dynamic” option, then set “Latest Price” as the condition target. Select Greater as the operator to establish the “Lower Band > Latest Price” condition.
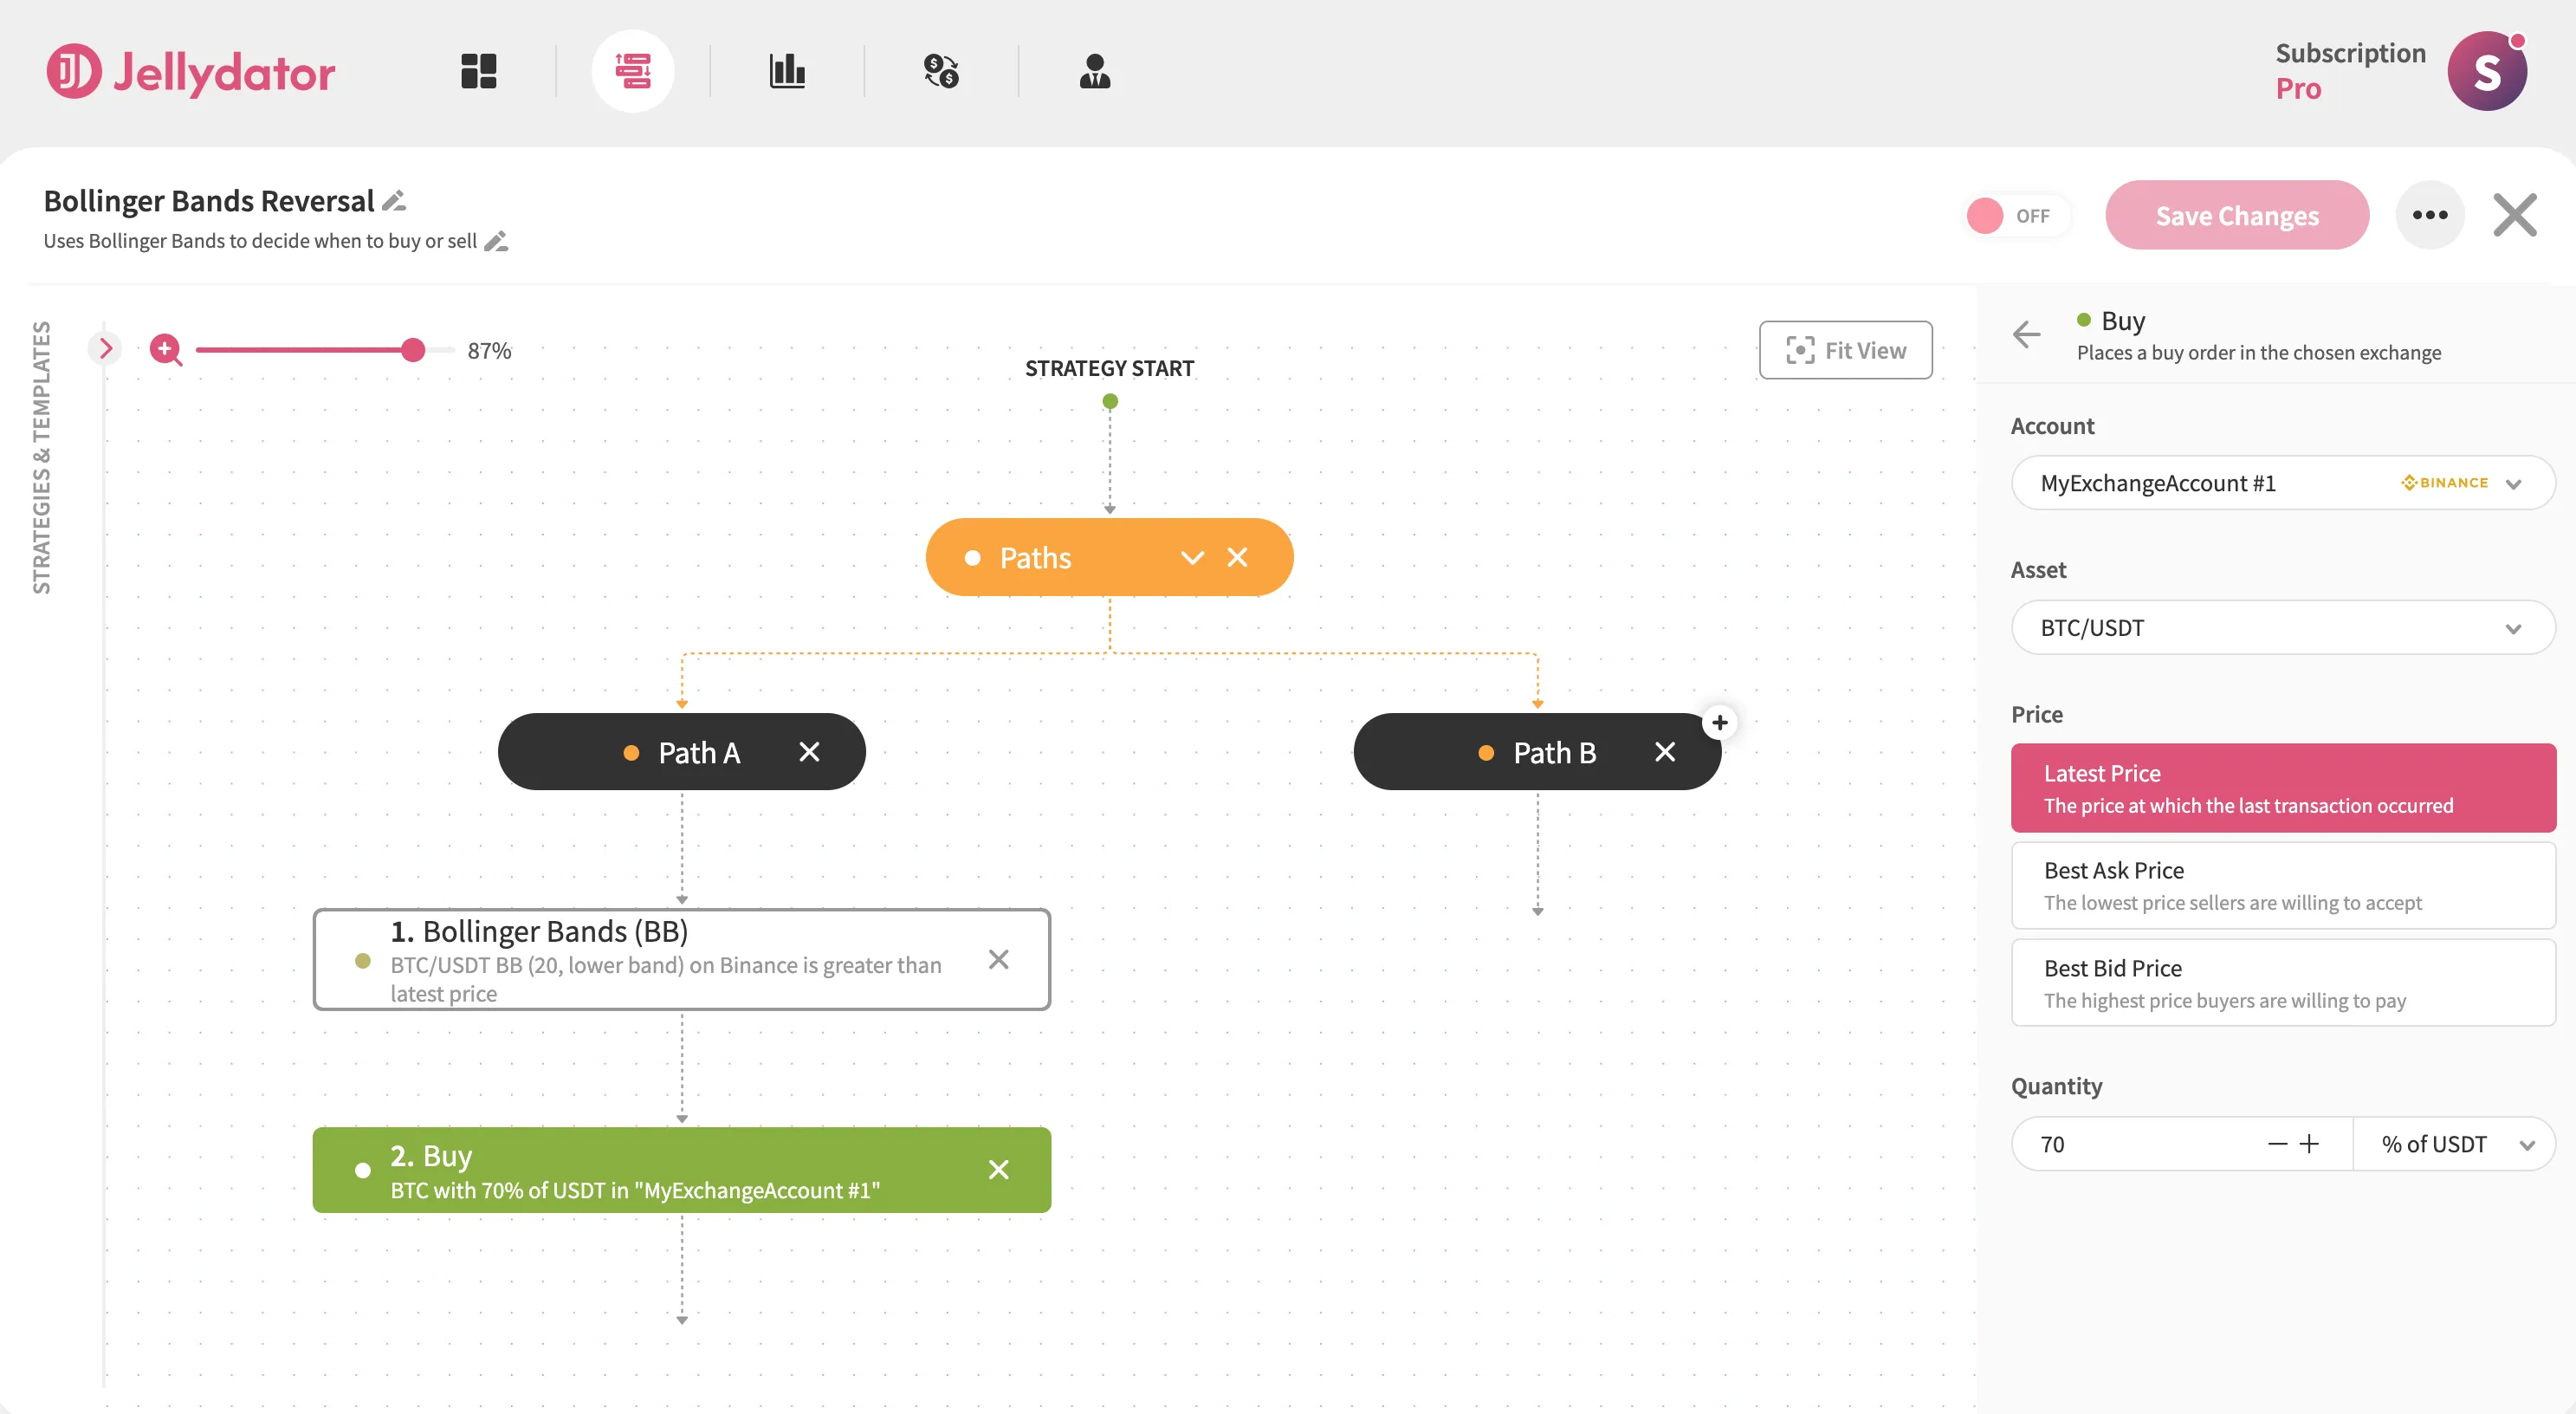
Directly beneath this step, add a Buy step configured for BTC/USDT. In its configuration panel, select the “Latest Price” option and allocate 70% of your USDT balance.
Path B Configuration
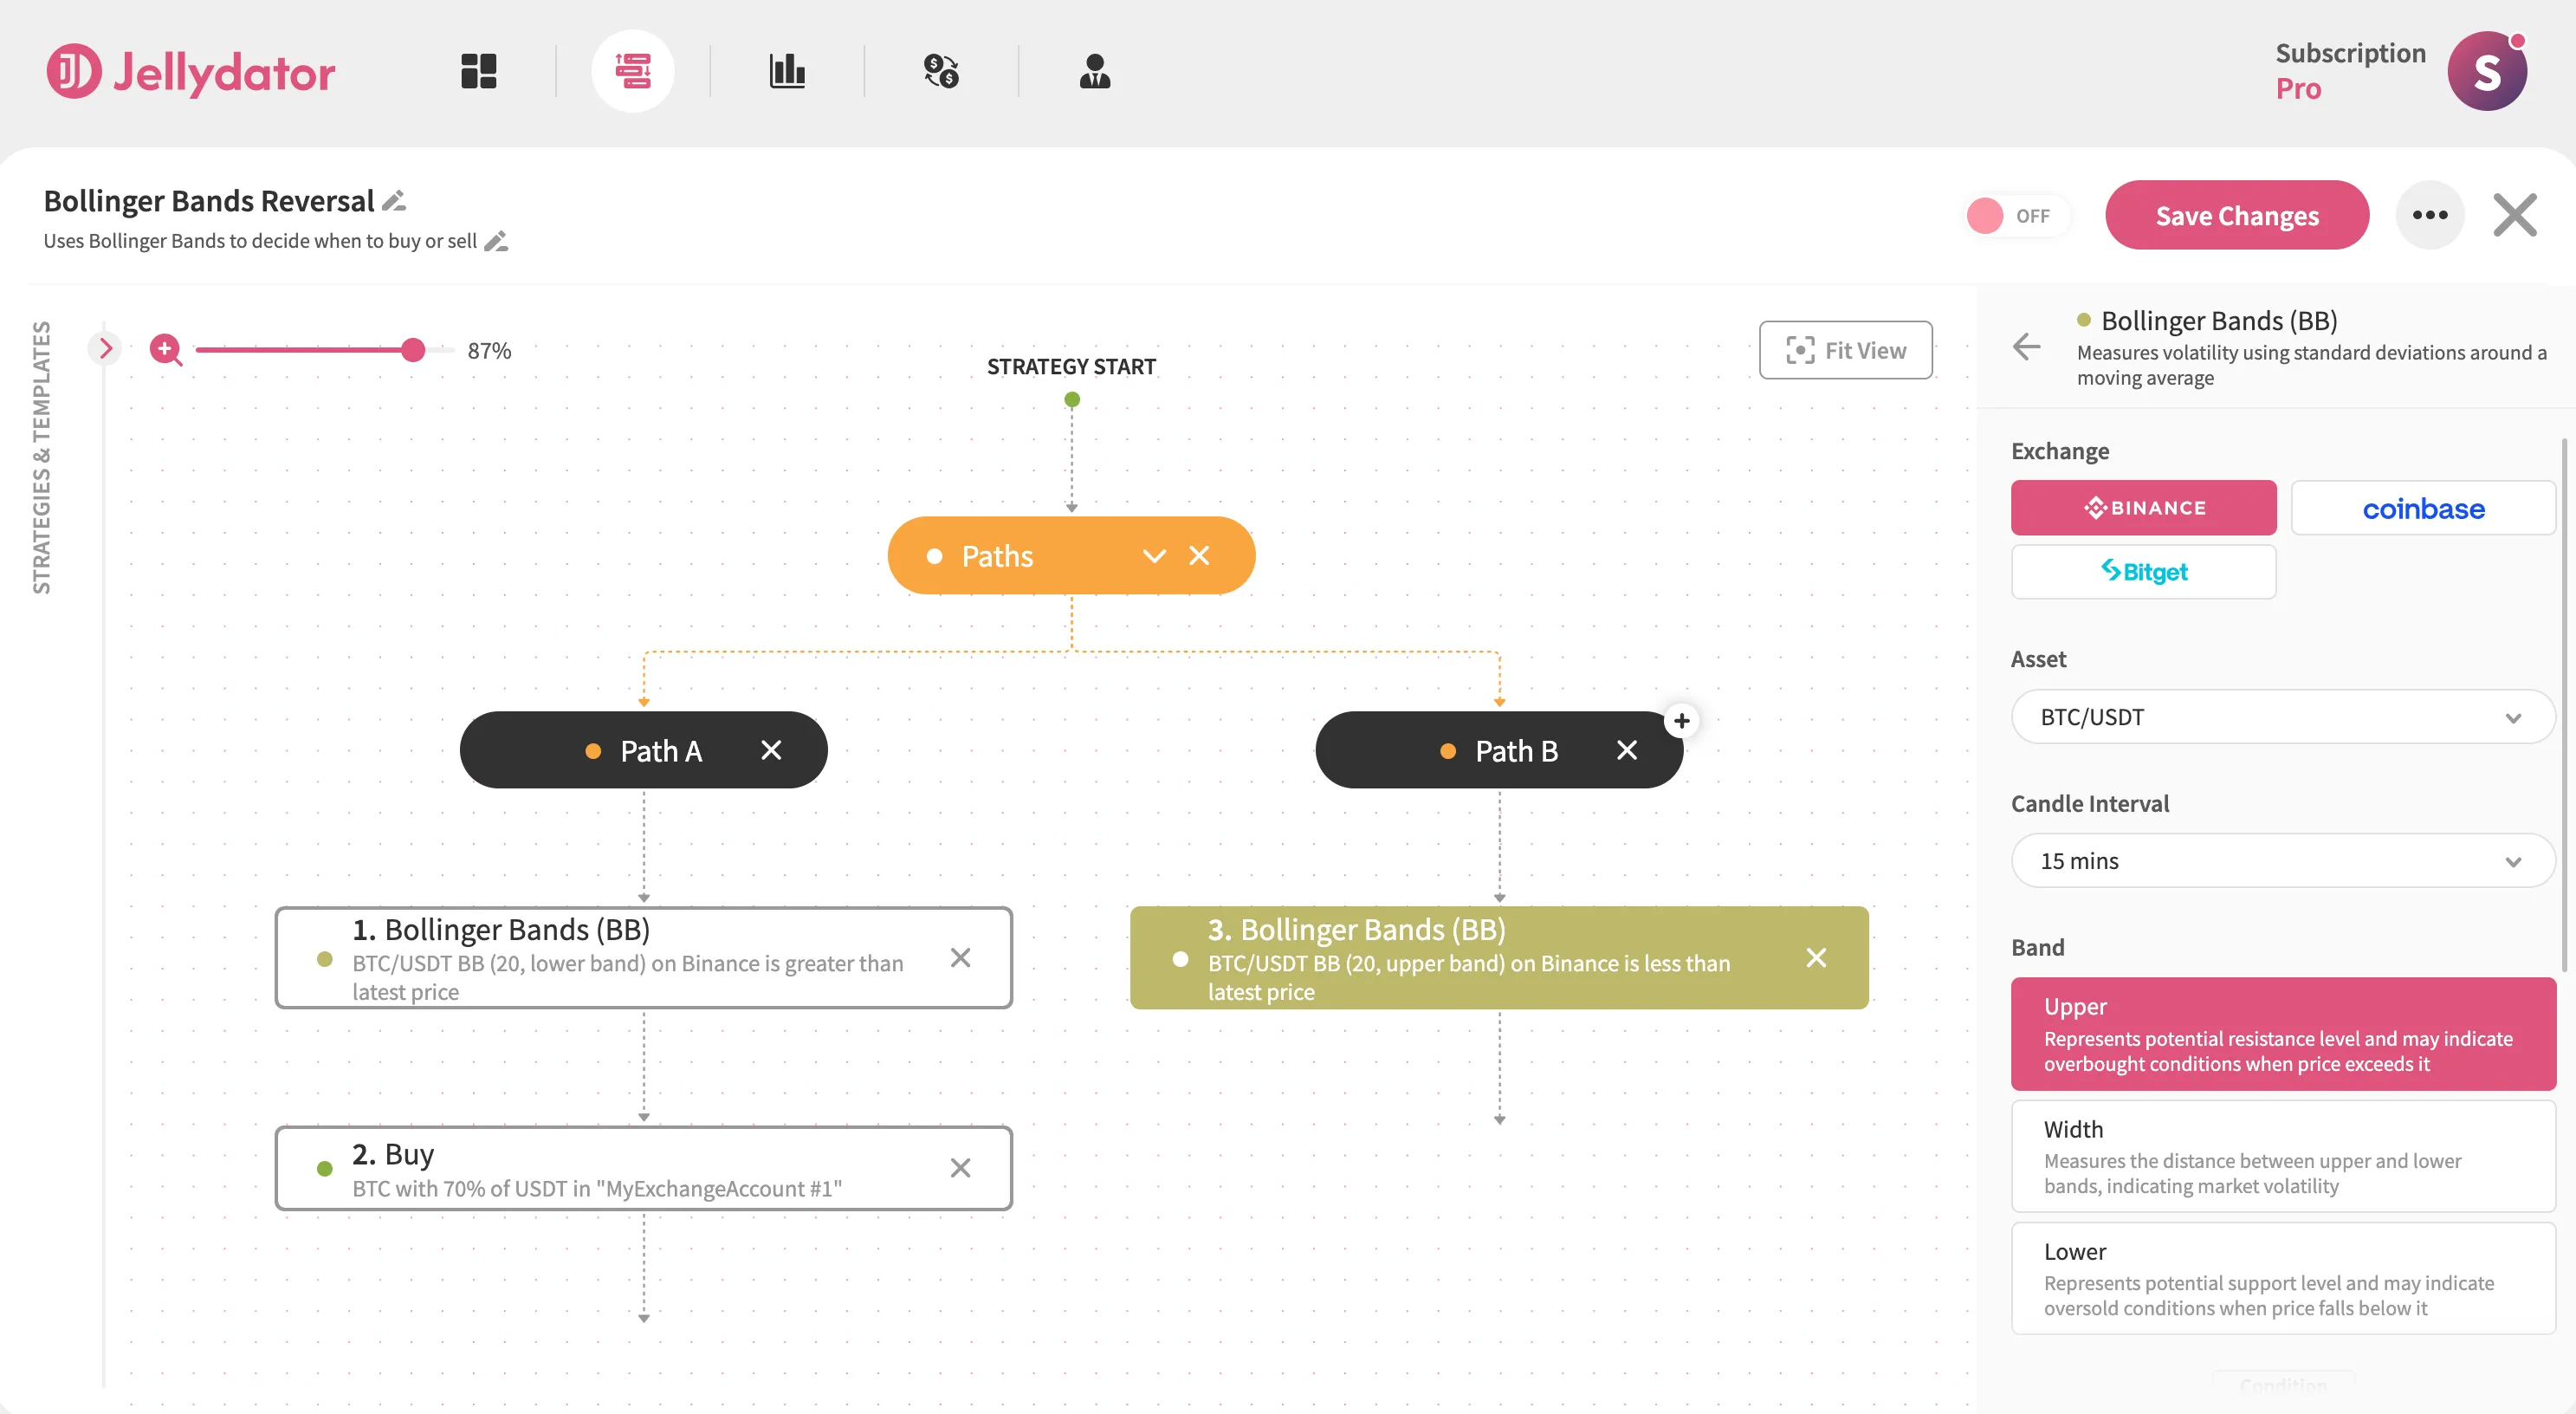
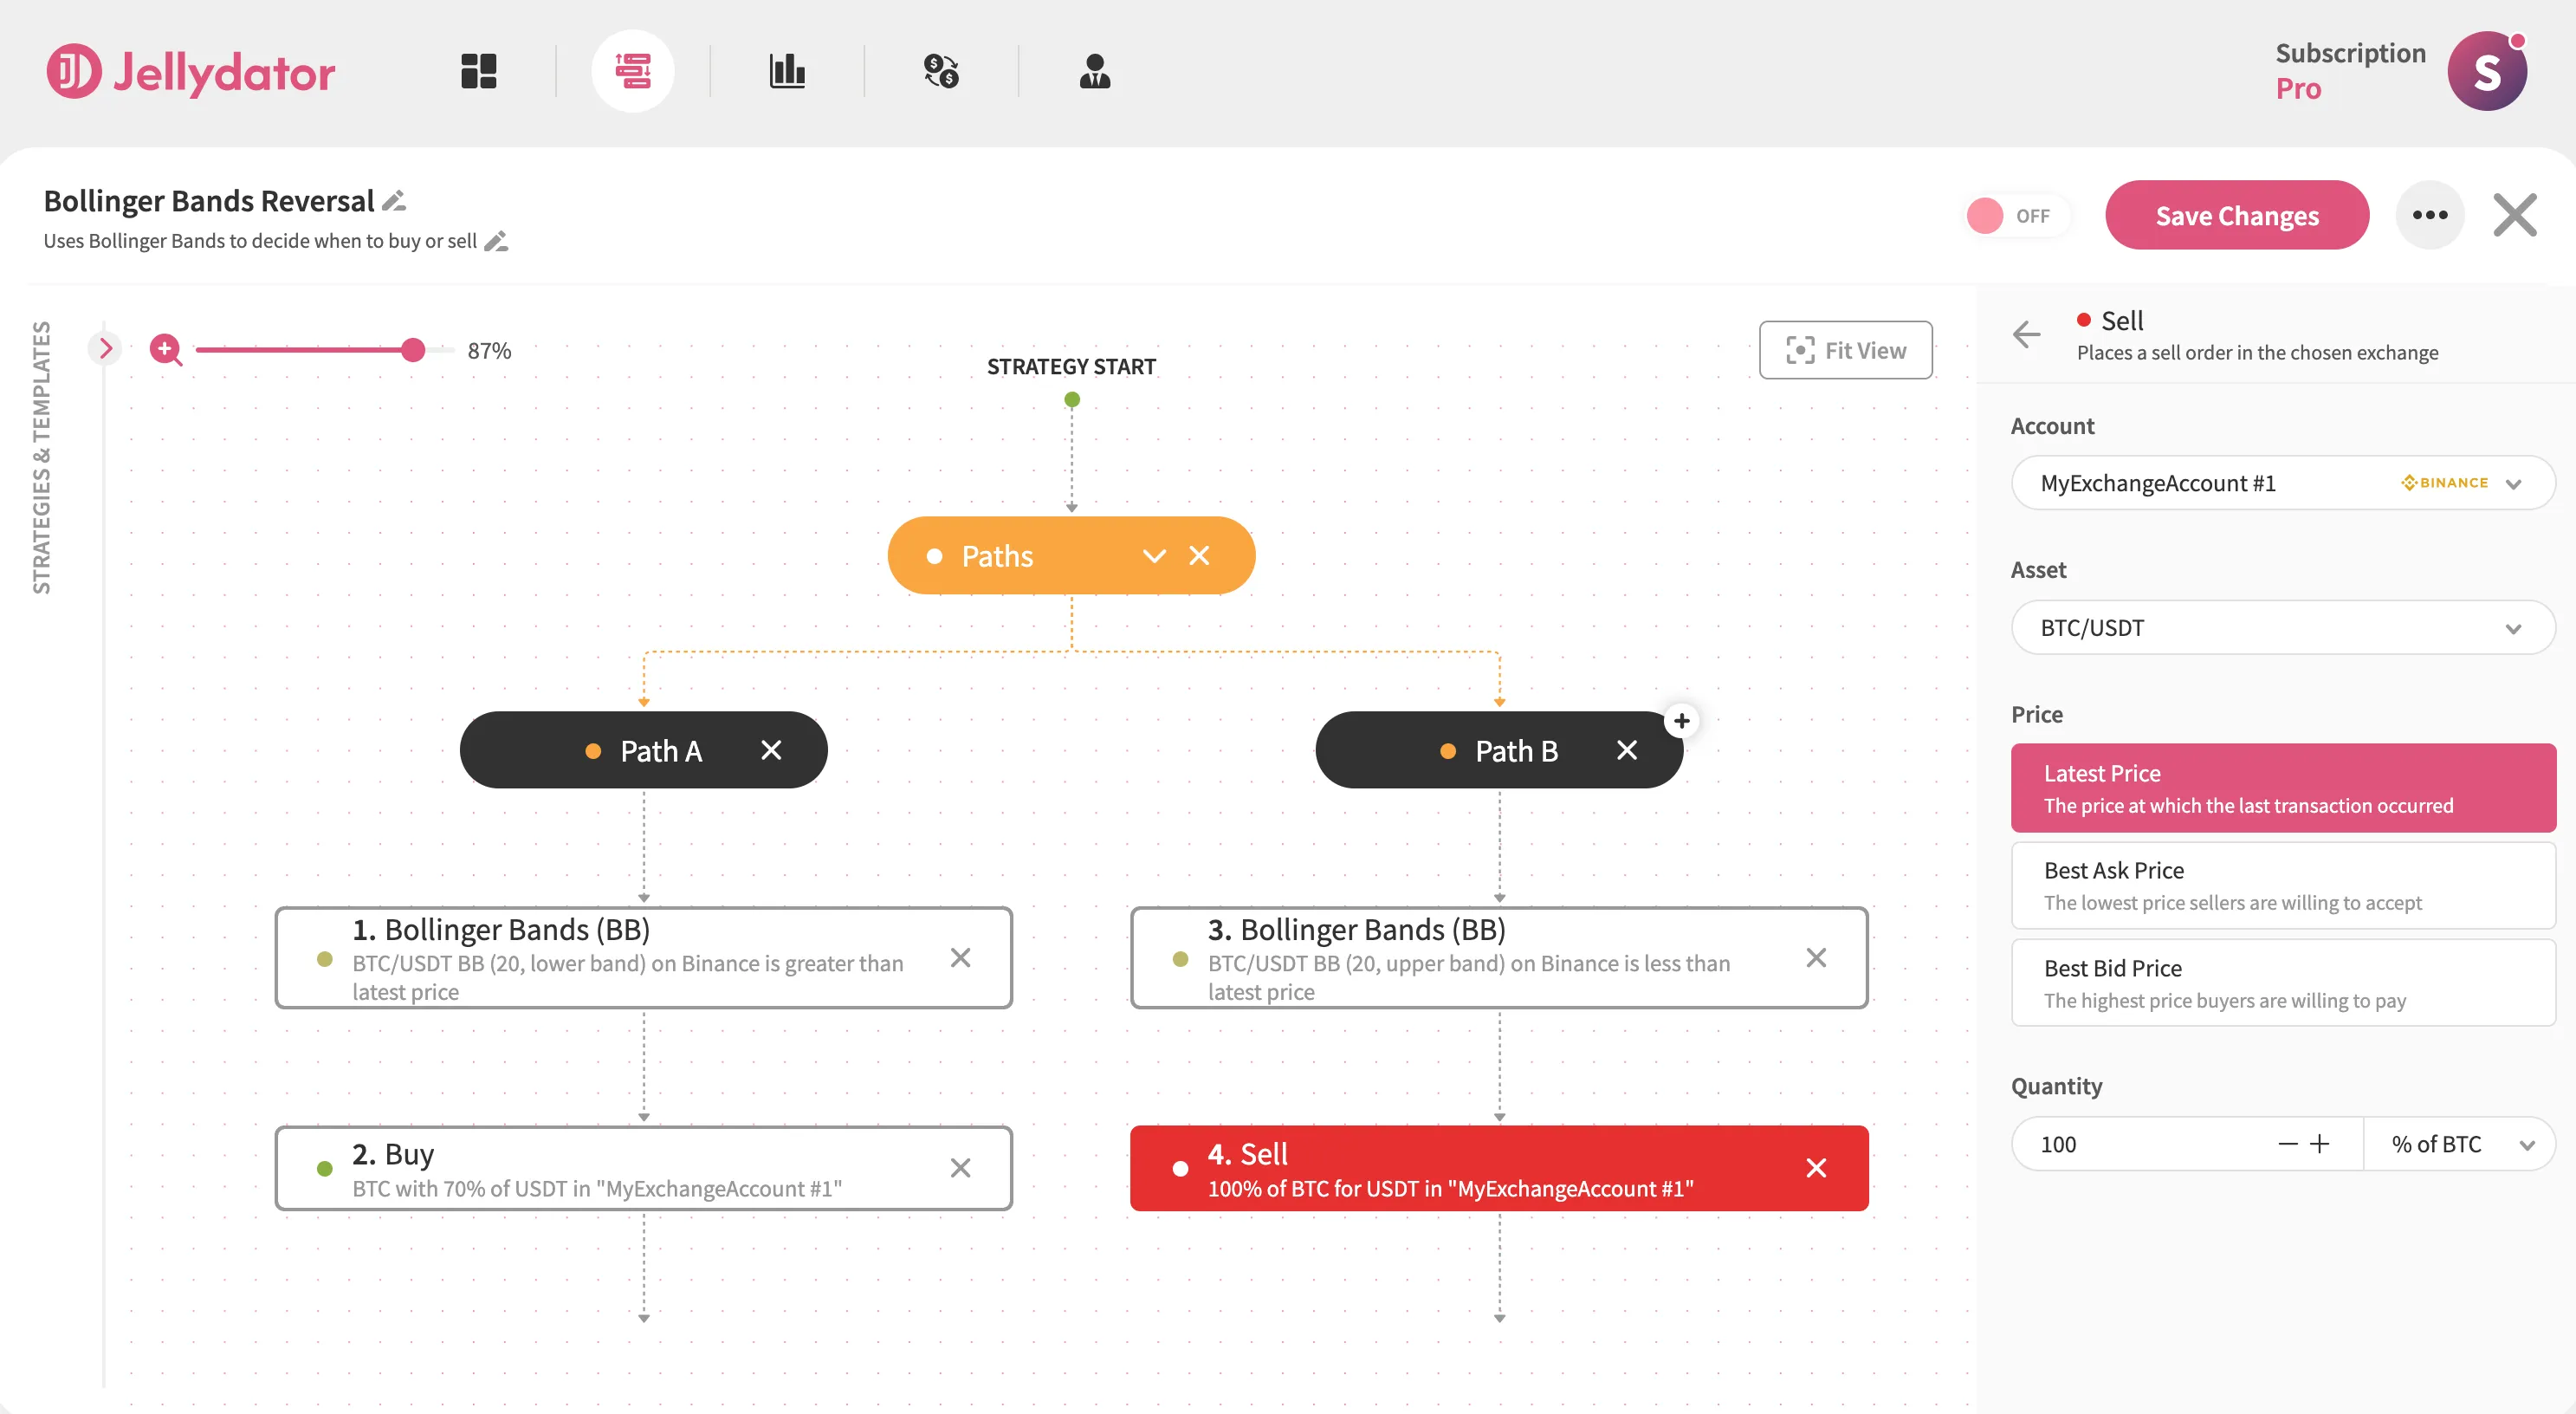
For Path B, add another Bollinger Bands step and access its configuration panel. Use the same BTC/USDT pair and 15-minute interval, but switch to calculating the upper band.
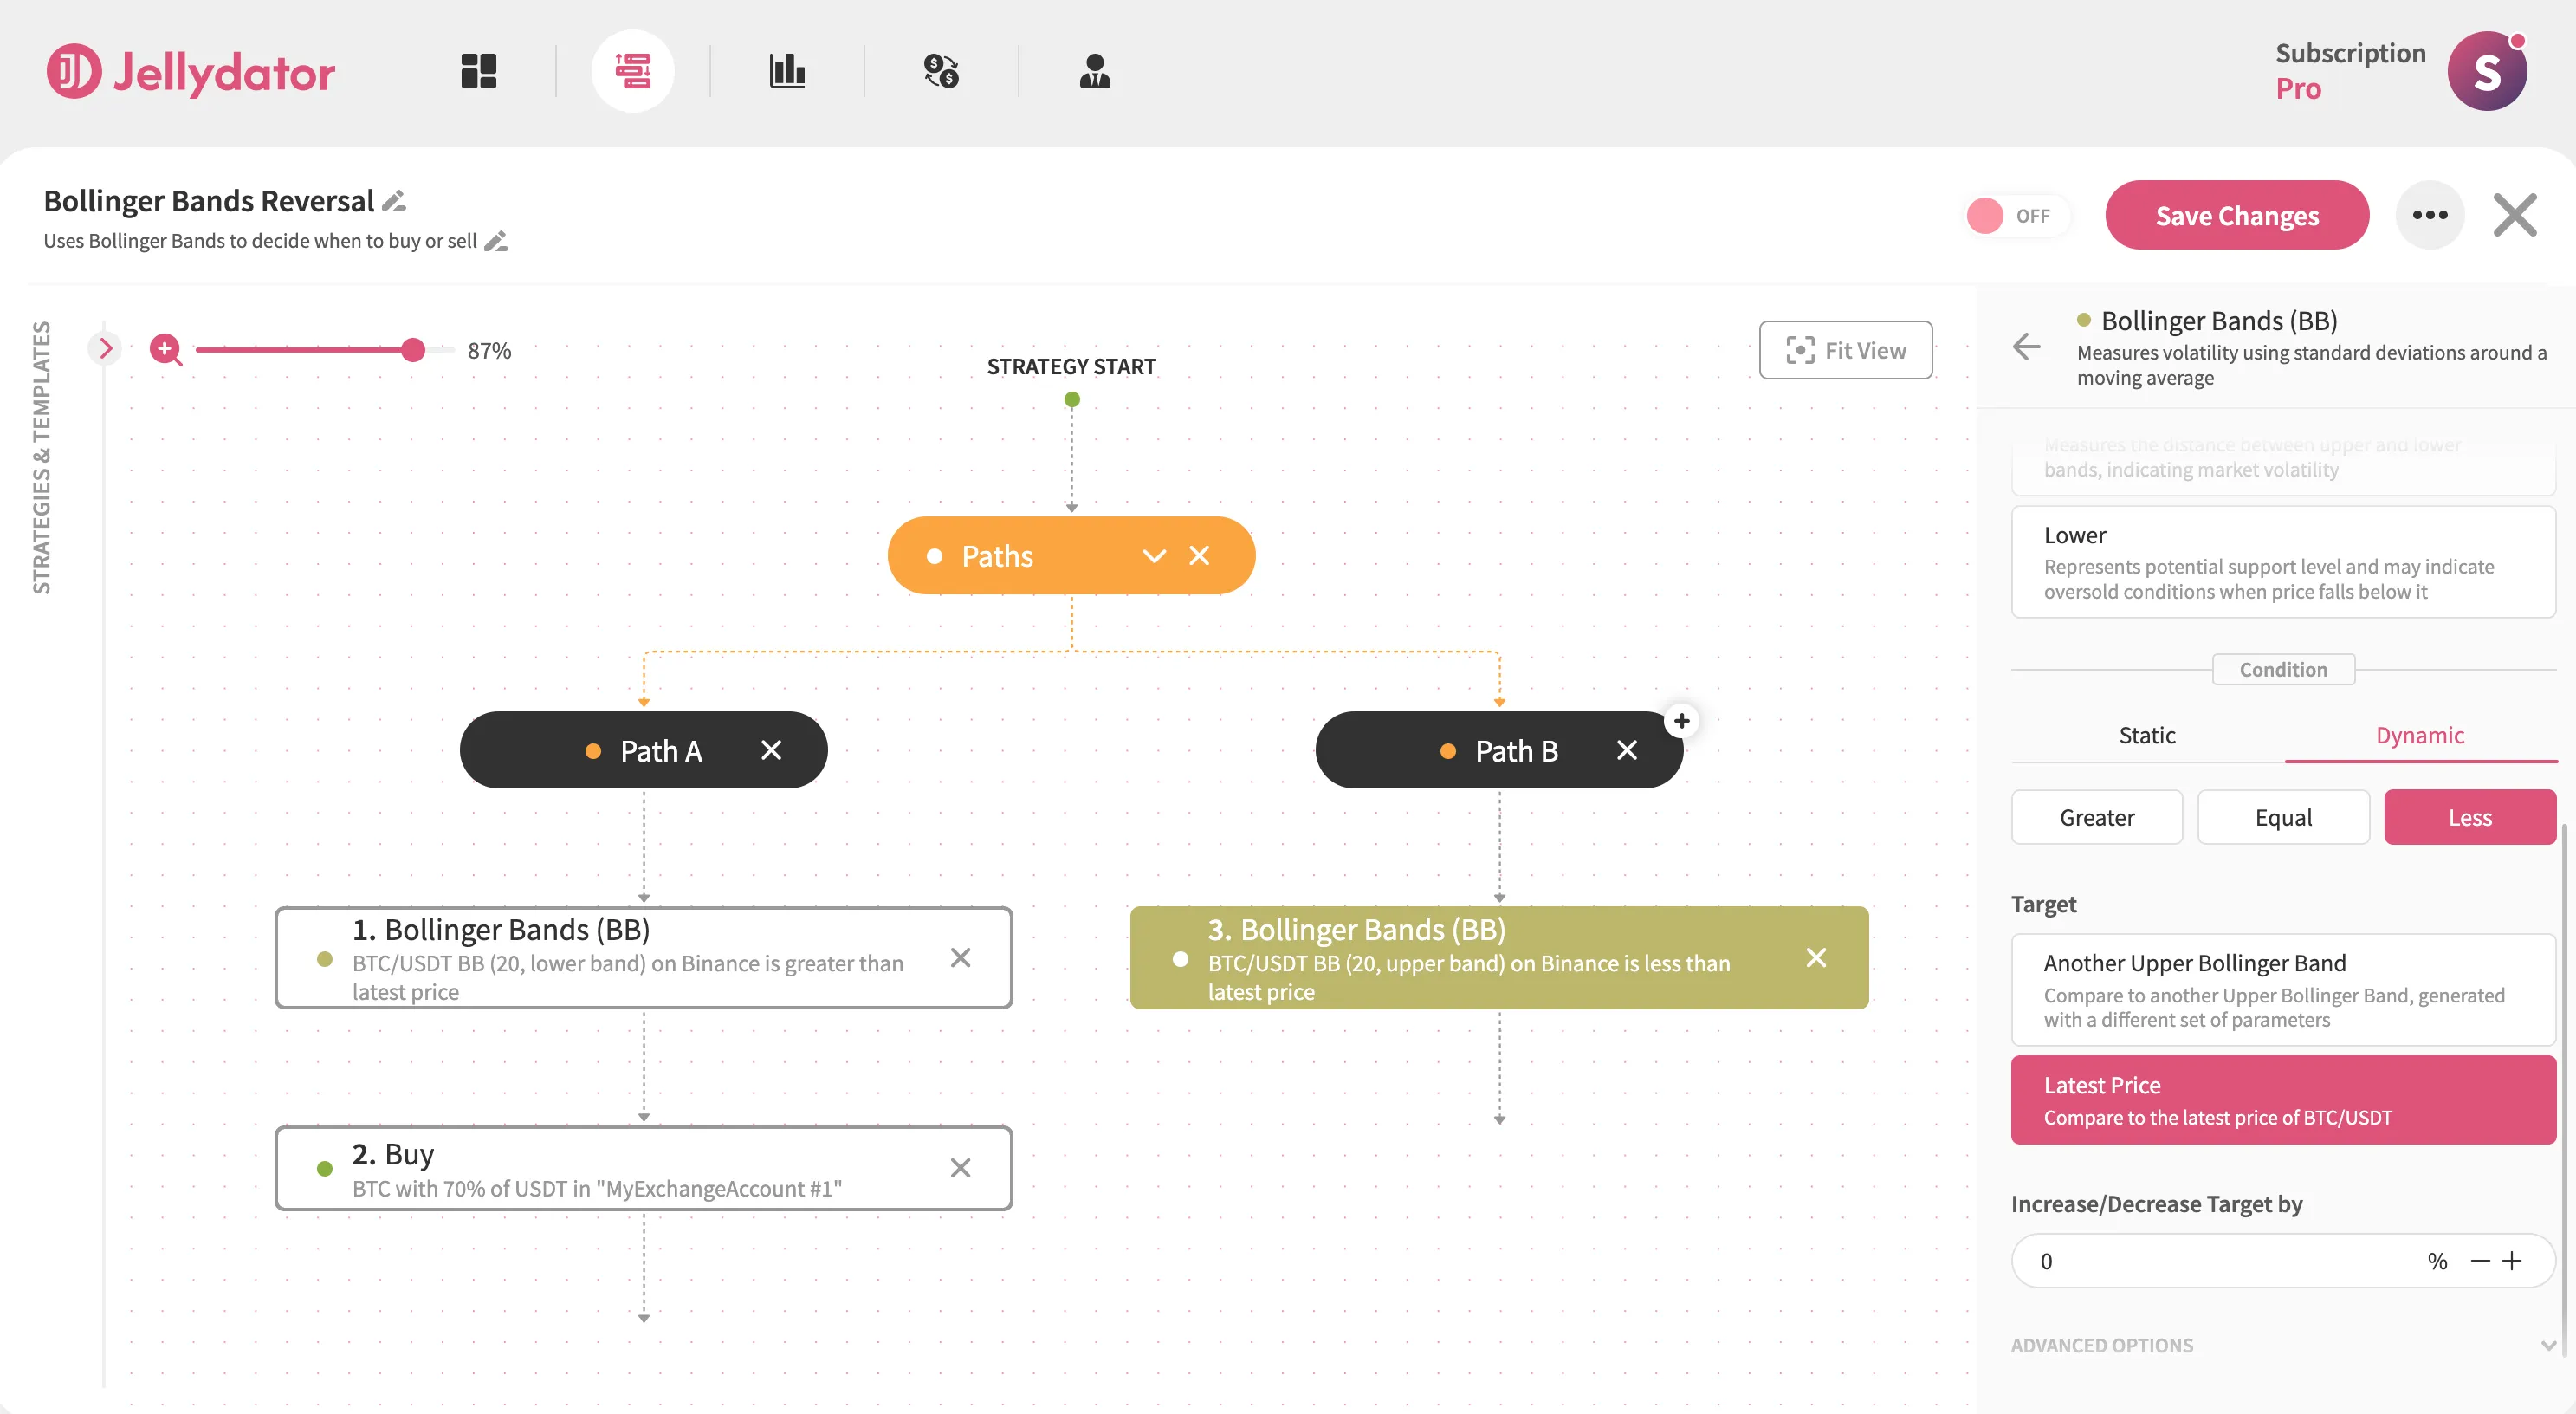
In the “Condition” section, choose the “Dynamic” option and “Latest Price” target again, then select Less as the operator to create the “Upper Band < Latest Price” condition.
Below this step, place a Sell step. It should use the same asset pair and price option as the Buy step. Set the quantity value to 100% of your BTC.
Additional Enhancements
Block Overlapping Orders
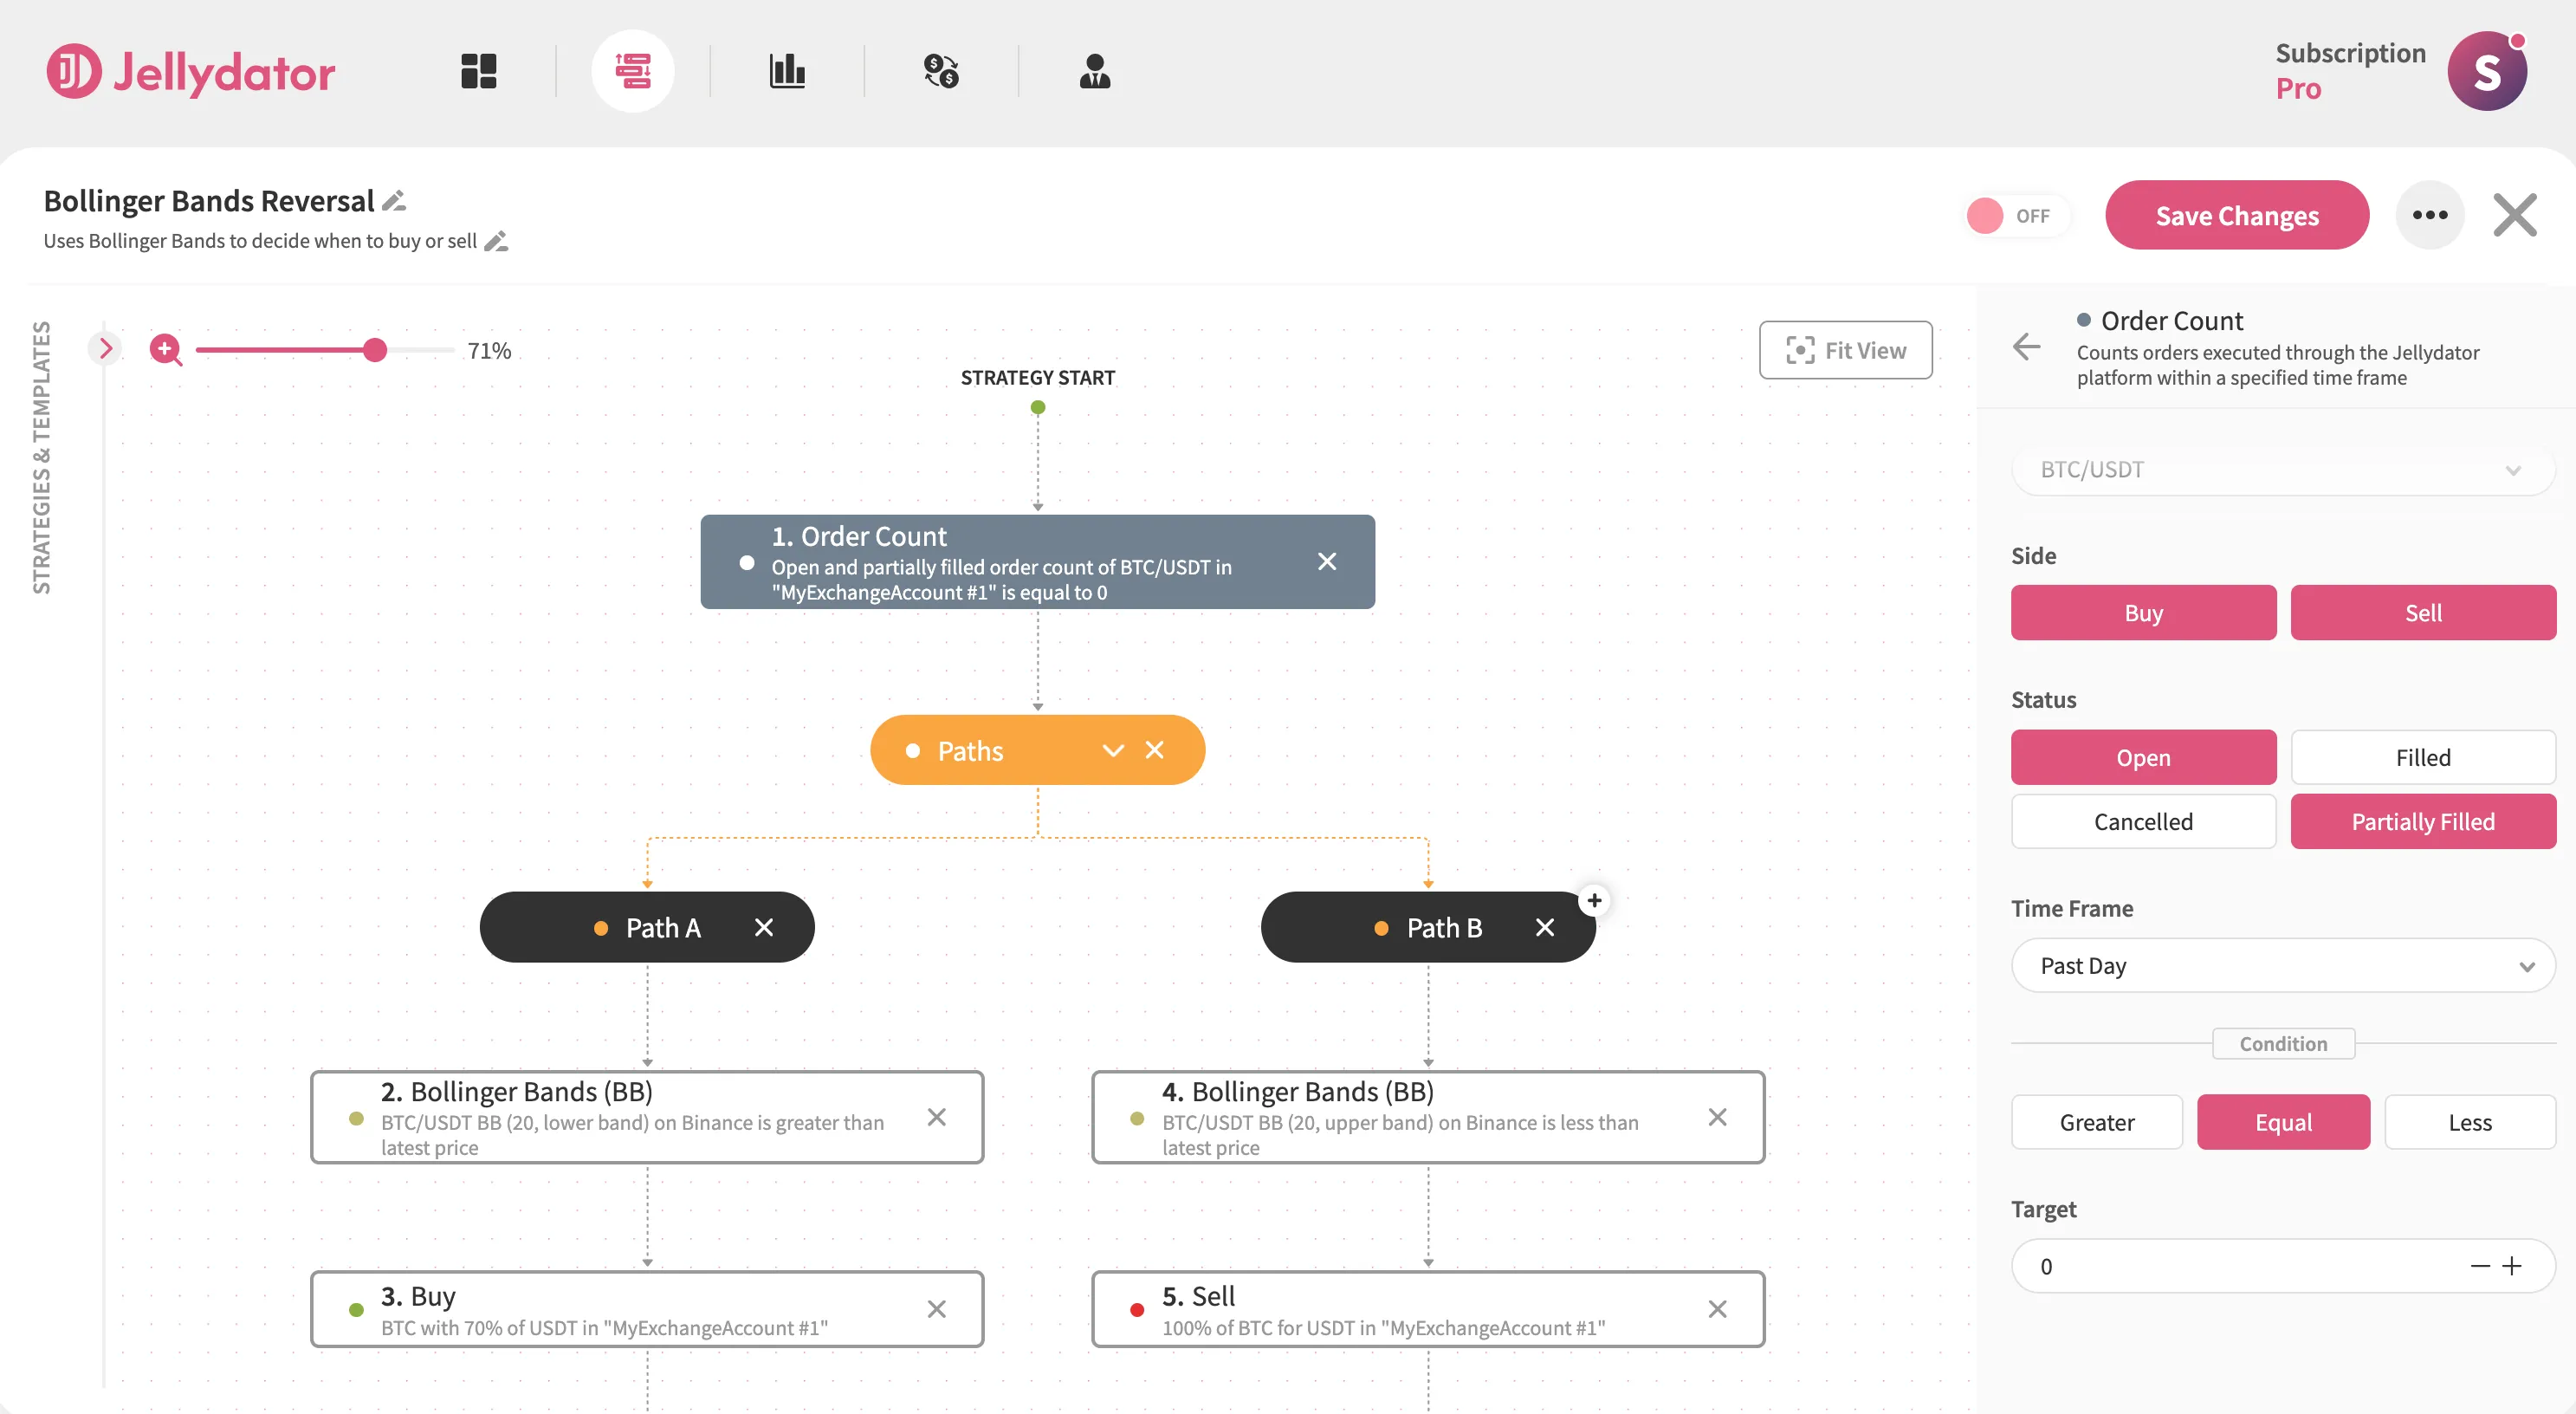
Add an Order Count step before your Paths to prevent duplicate trades. Configure it to check BTC/USDT orders with both buy and sell sides. Set status filters to “Open” and “Partially Filled.”
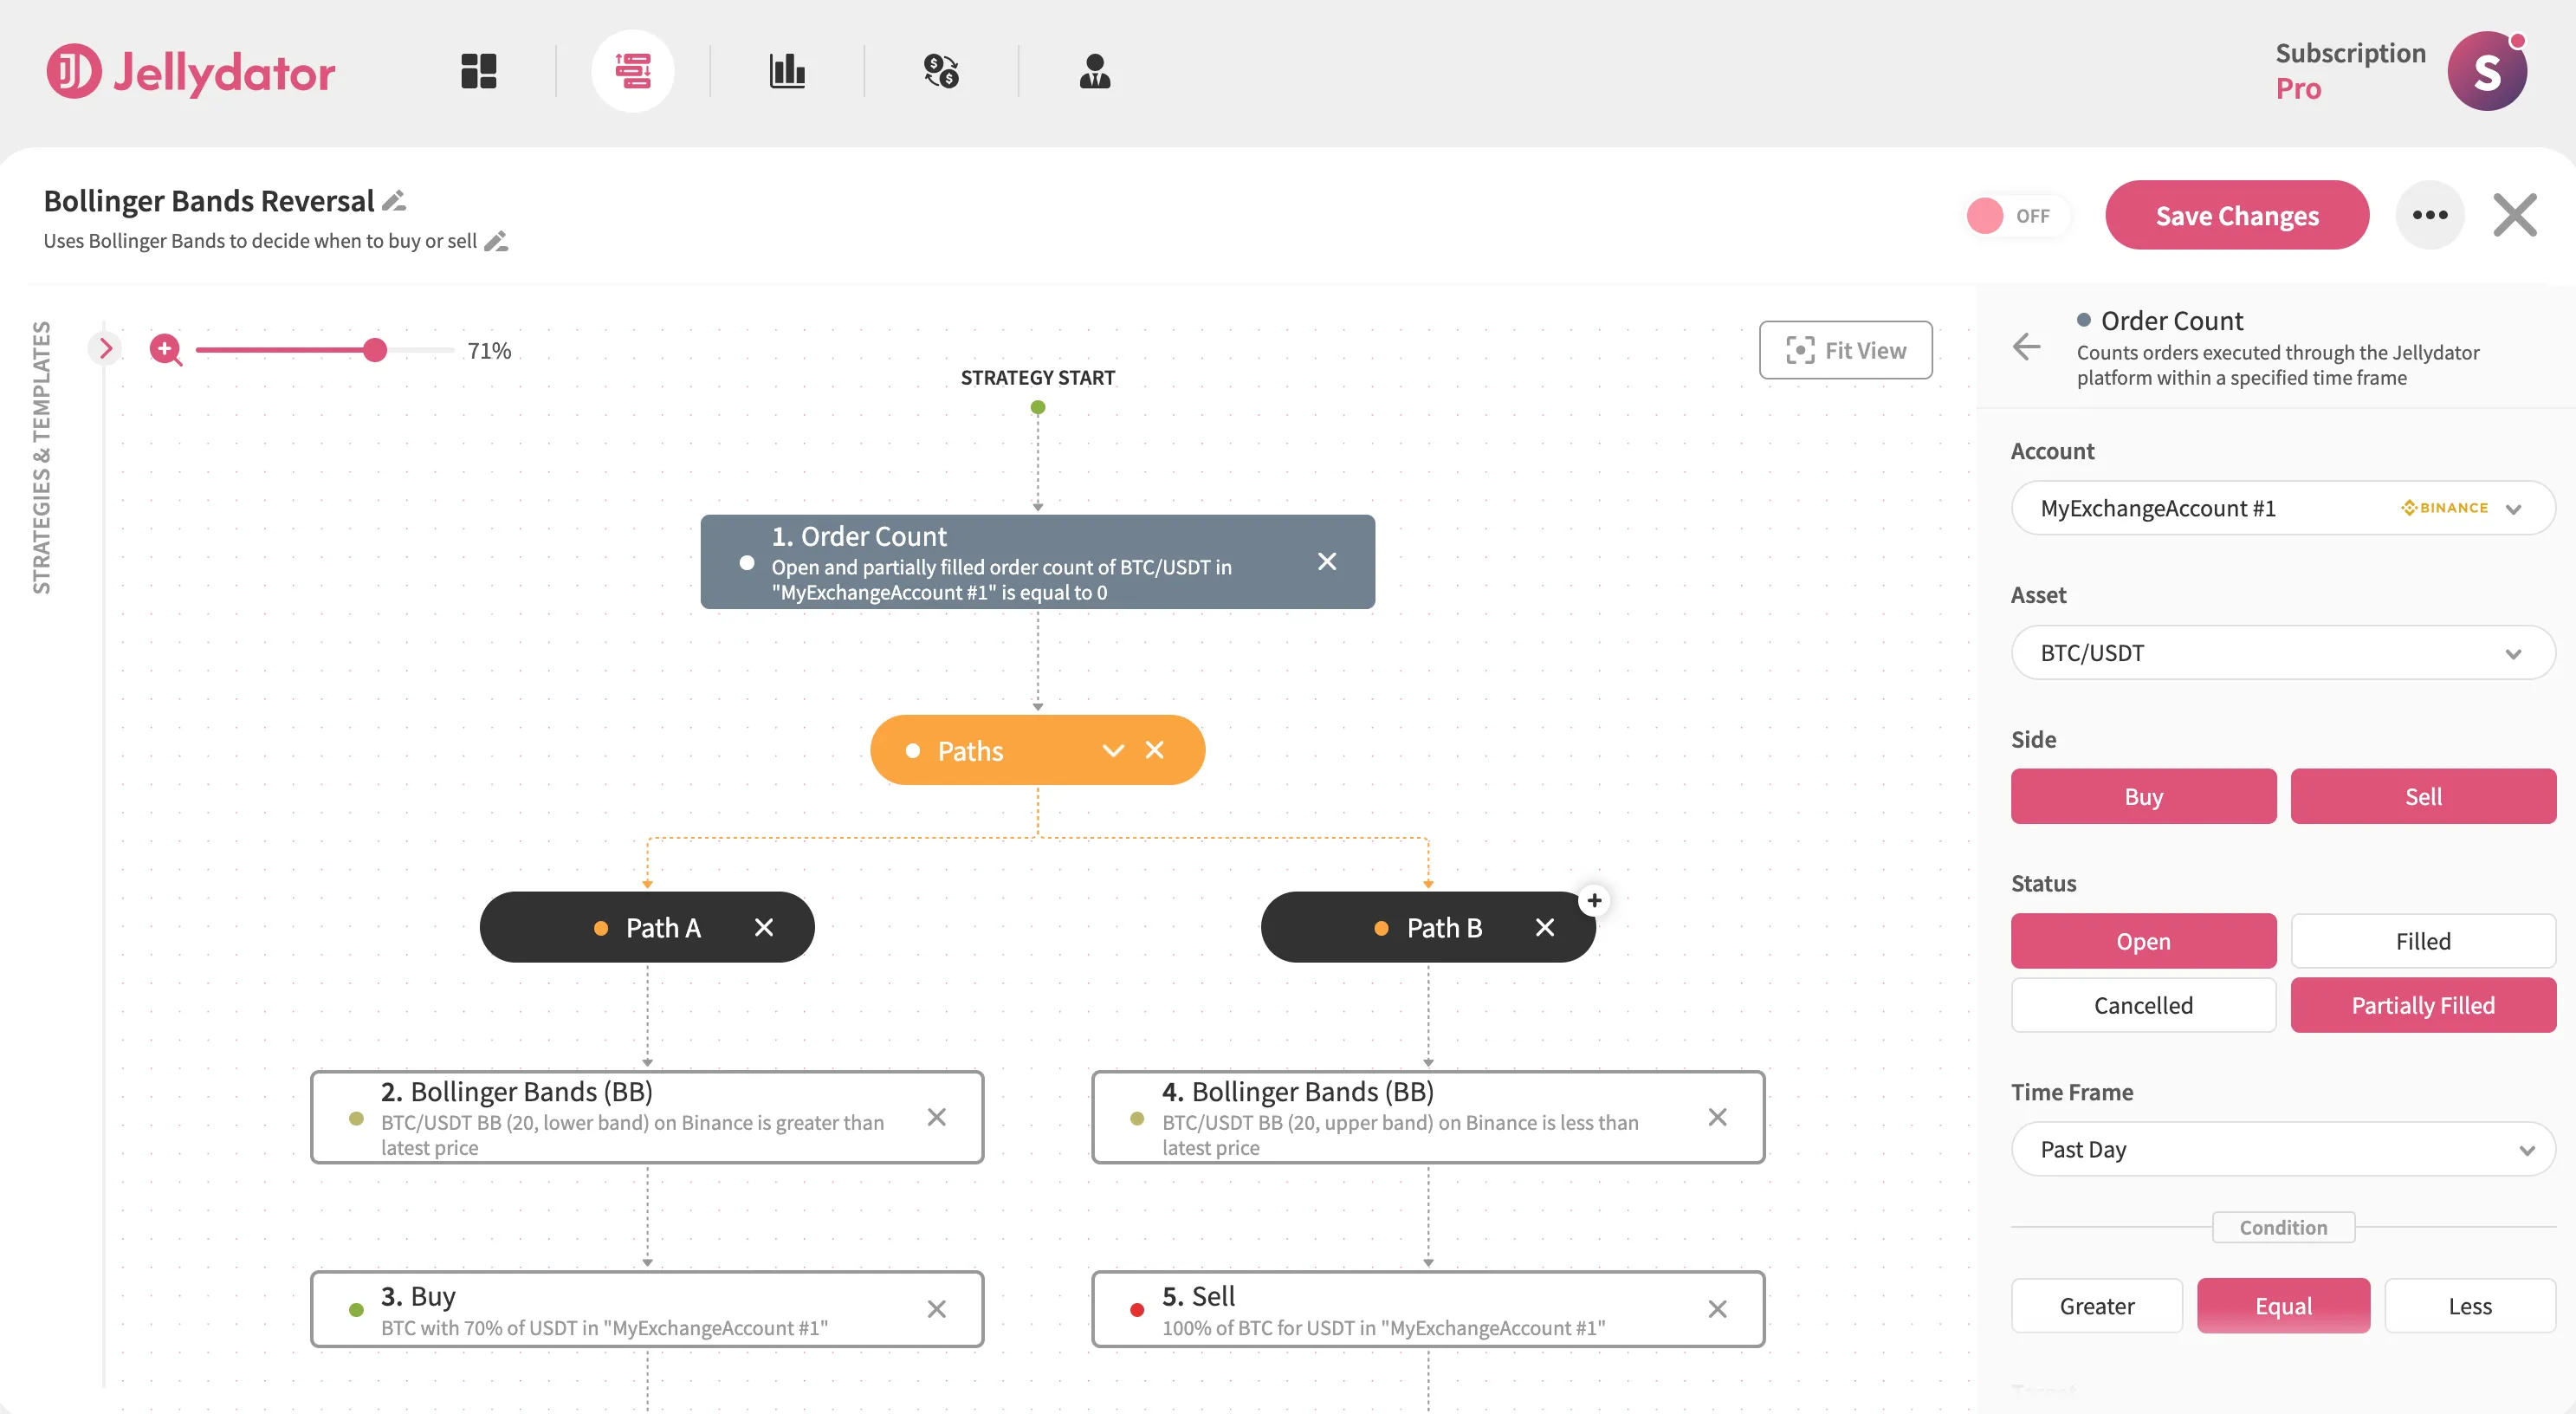
Then, create the condition “Equal to 0”. This crucial check ensures your strategy only acts when previous orders are fully completed, maintaining clean trade execution.
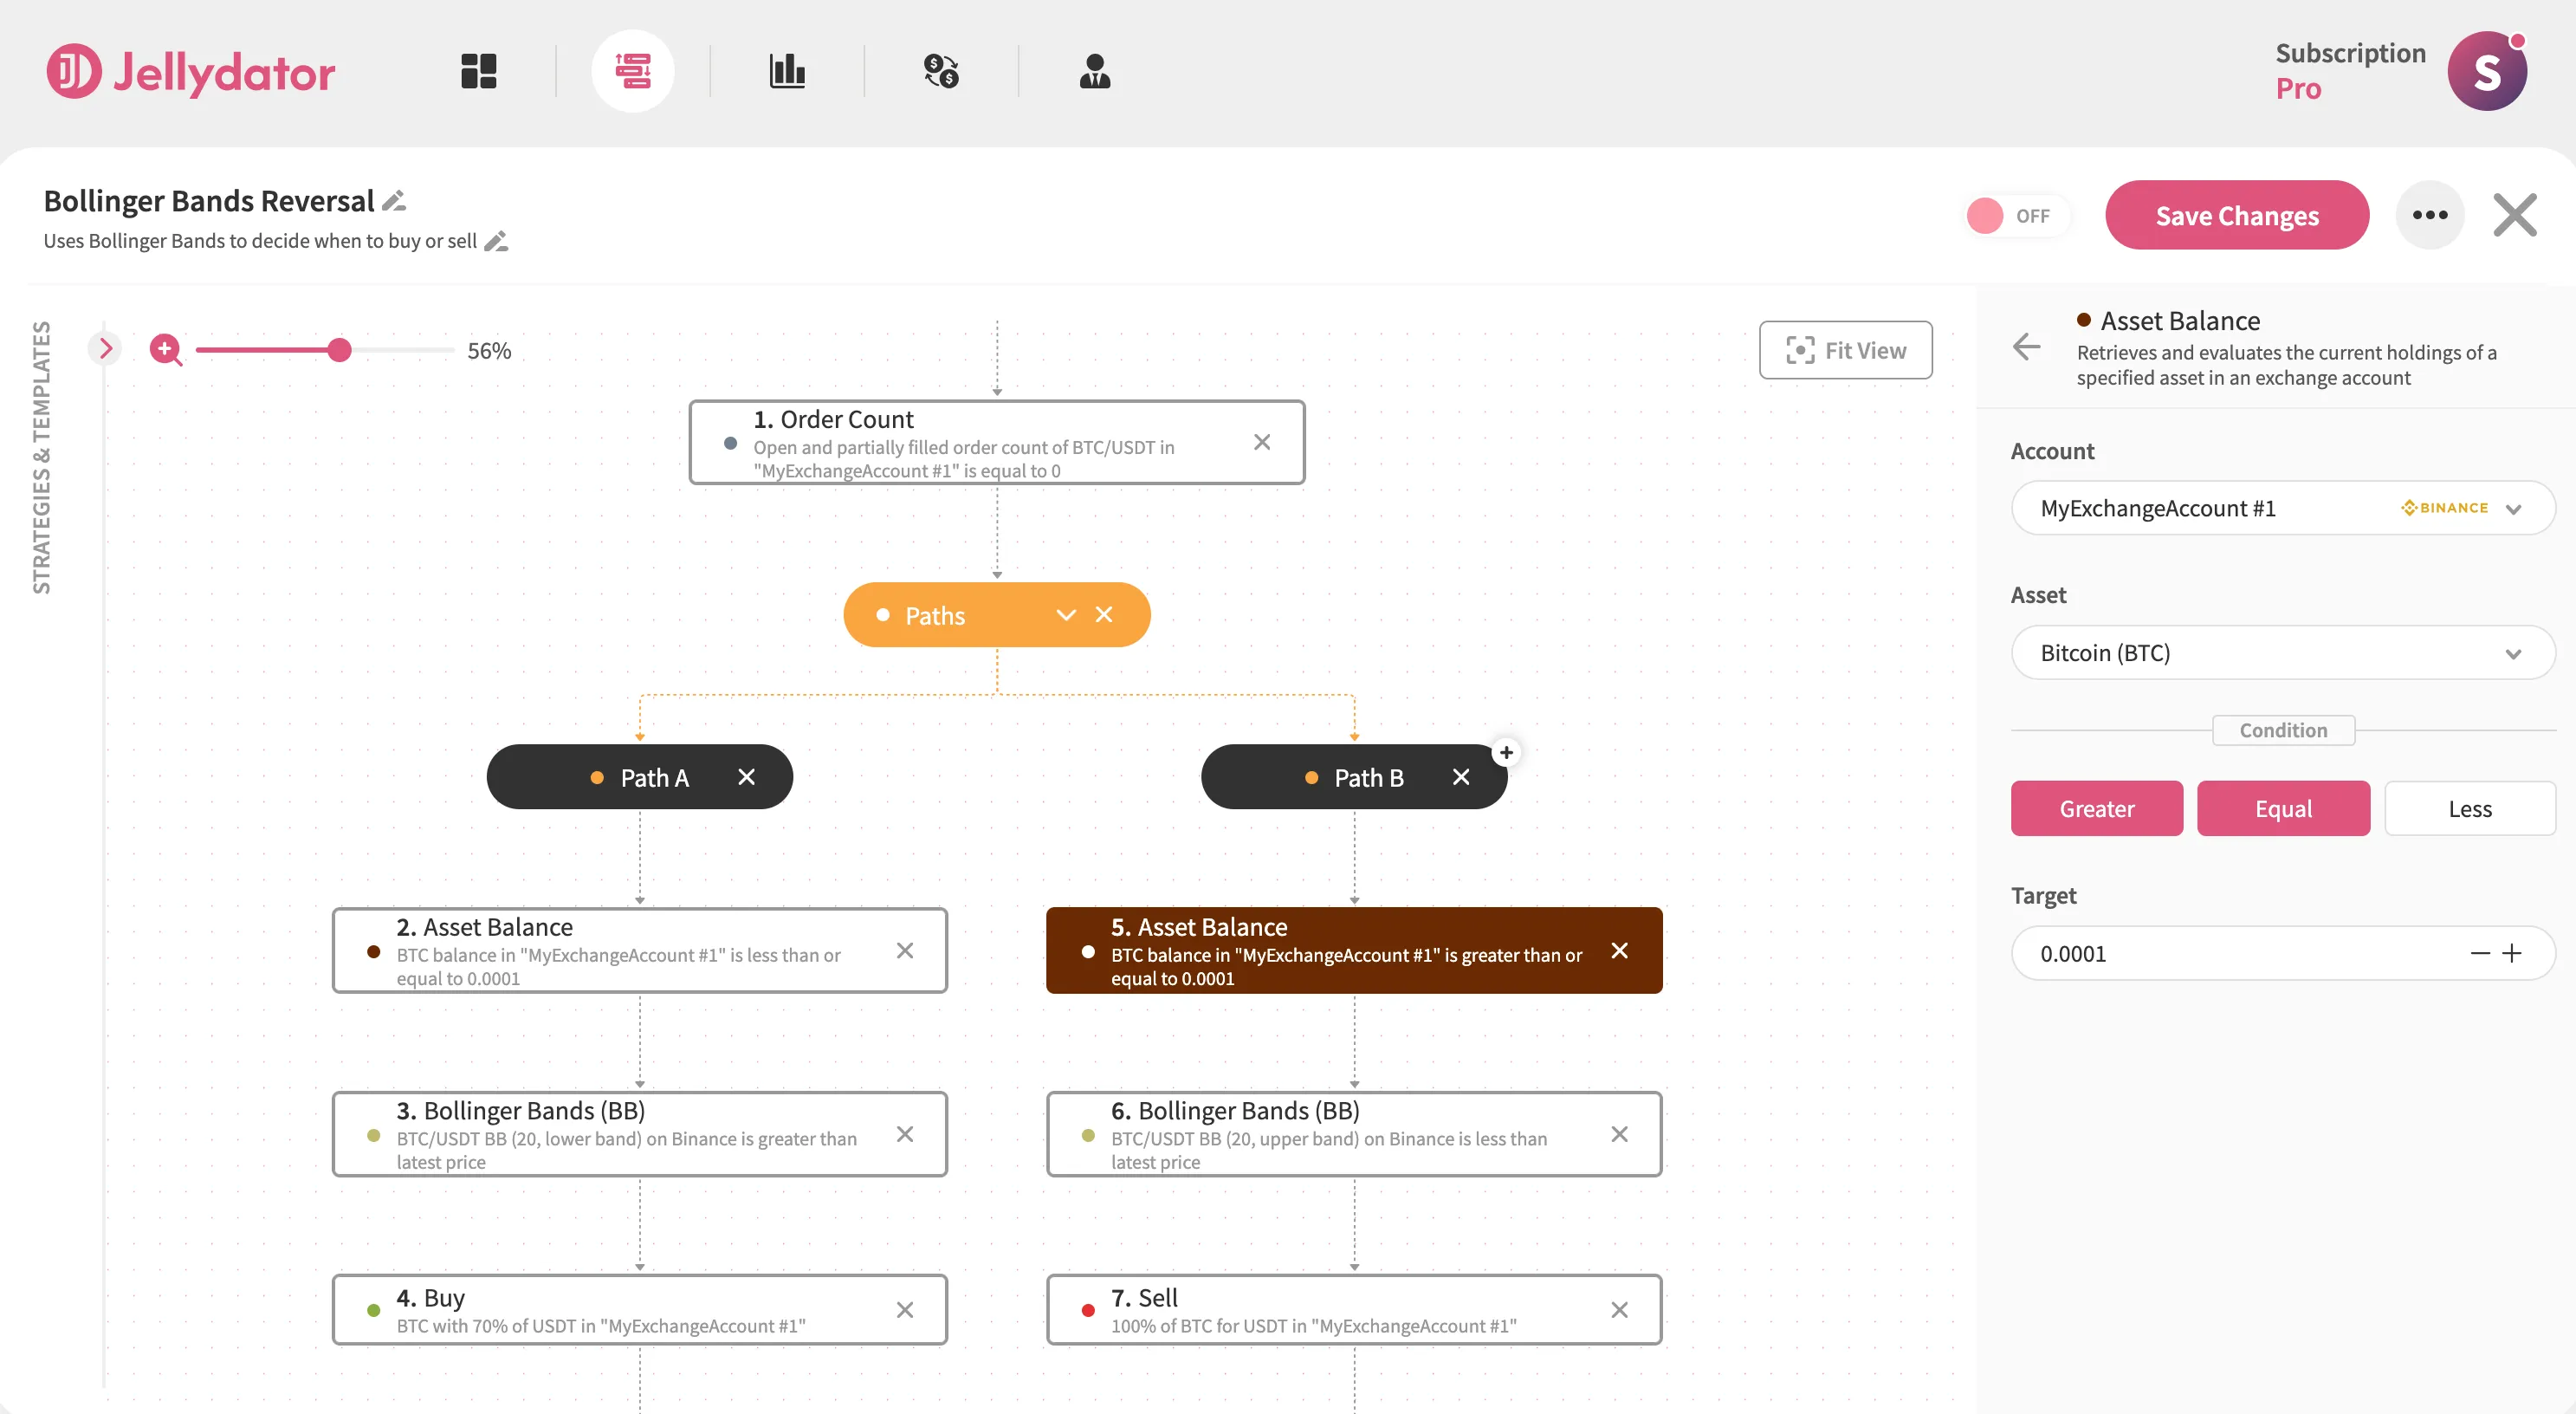
Add Balance Verification Steps
In Path A, add an Asset Balance step for BTC. Set the condition to “Less Than or Equal To” a small amount like 0.0001 BTC—this ignores residual “dust” while treating your balance as effectively empty for buying.
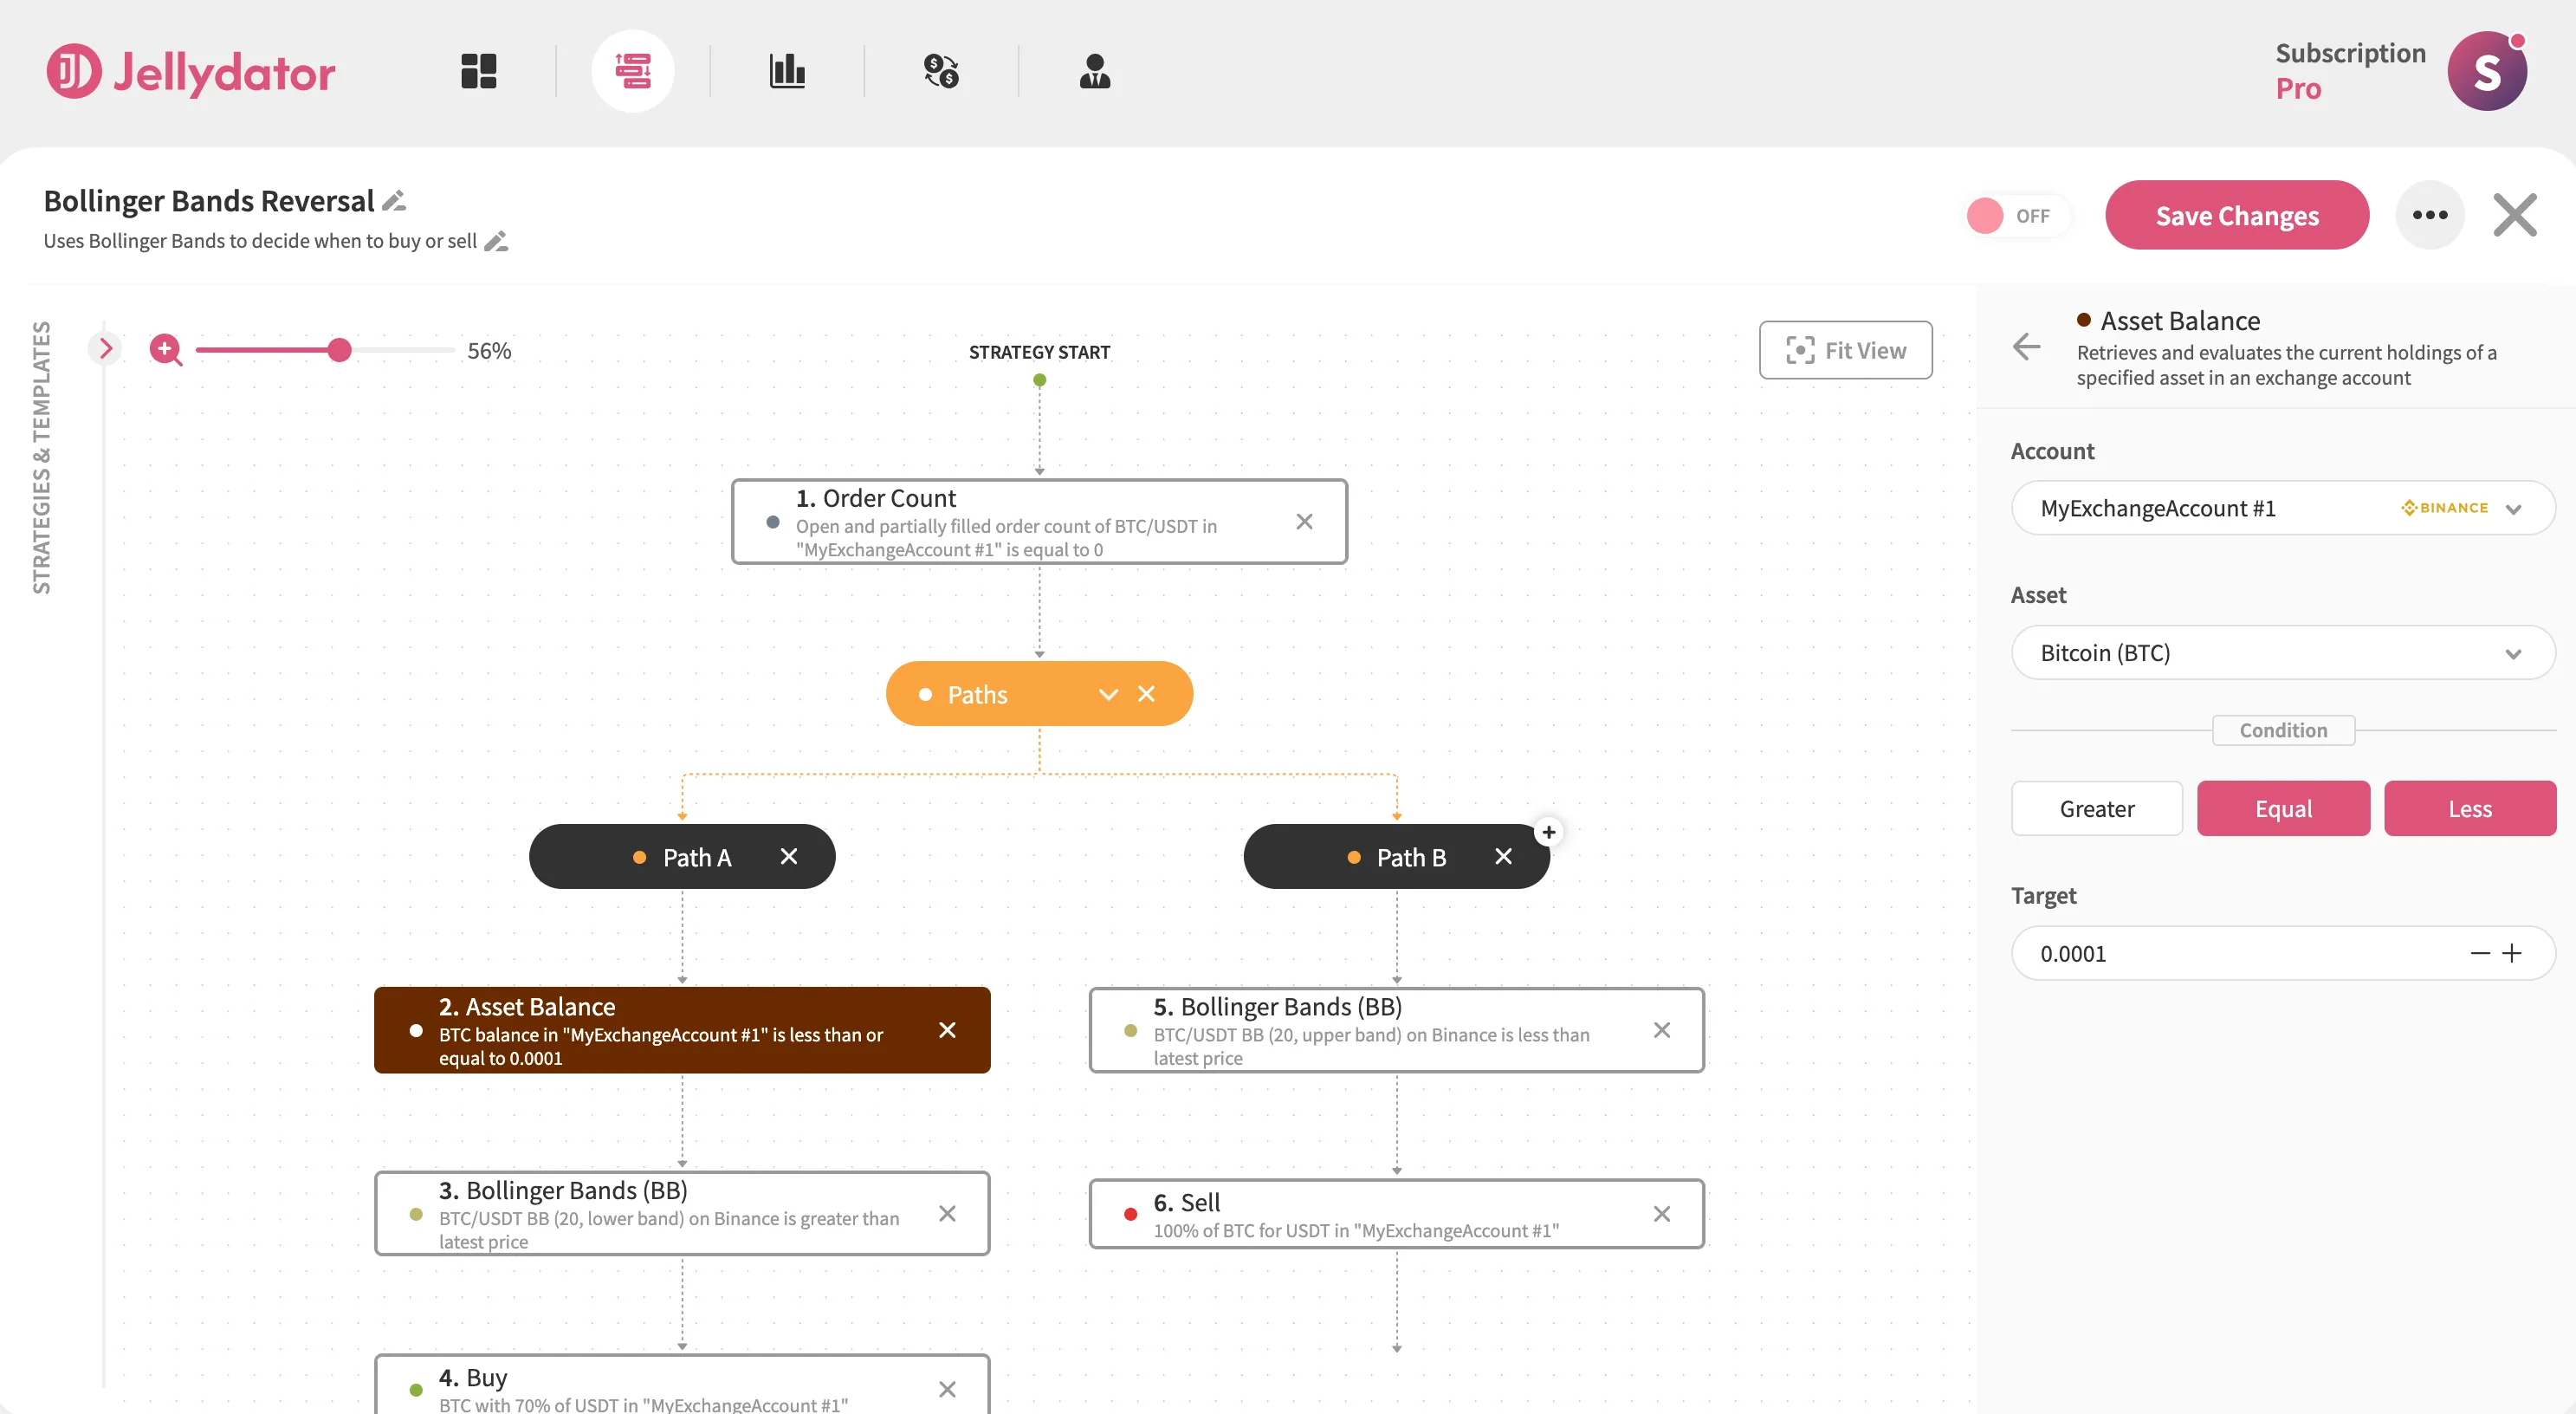
In Path B, add another Asset Balance step for BTC with “Greater Than or Equal To” the same threshold. This ensures you only sell when holding a tradable quantity. Together, these steps maintain clean position management across both entry and exit points.
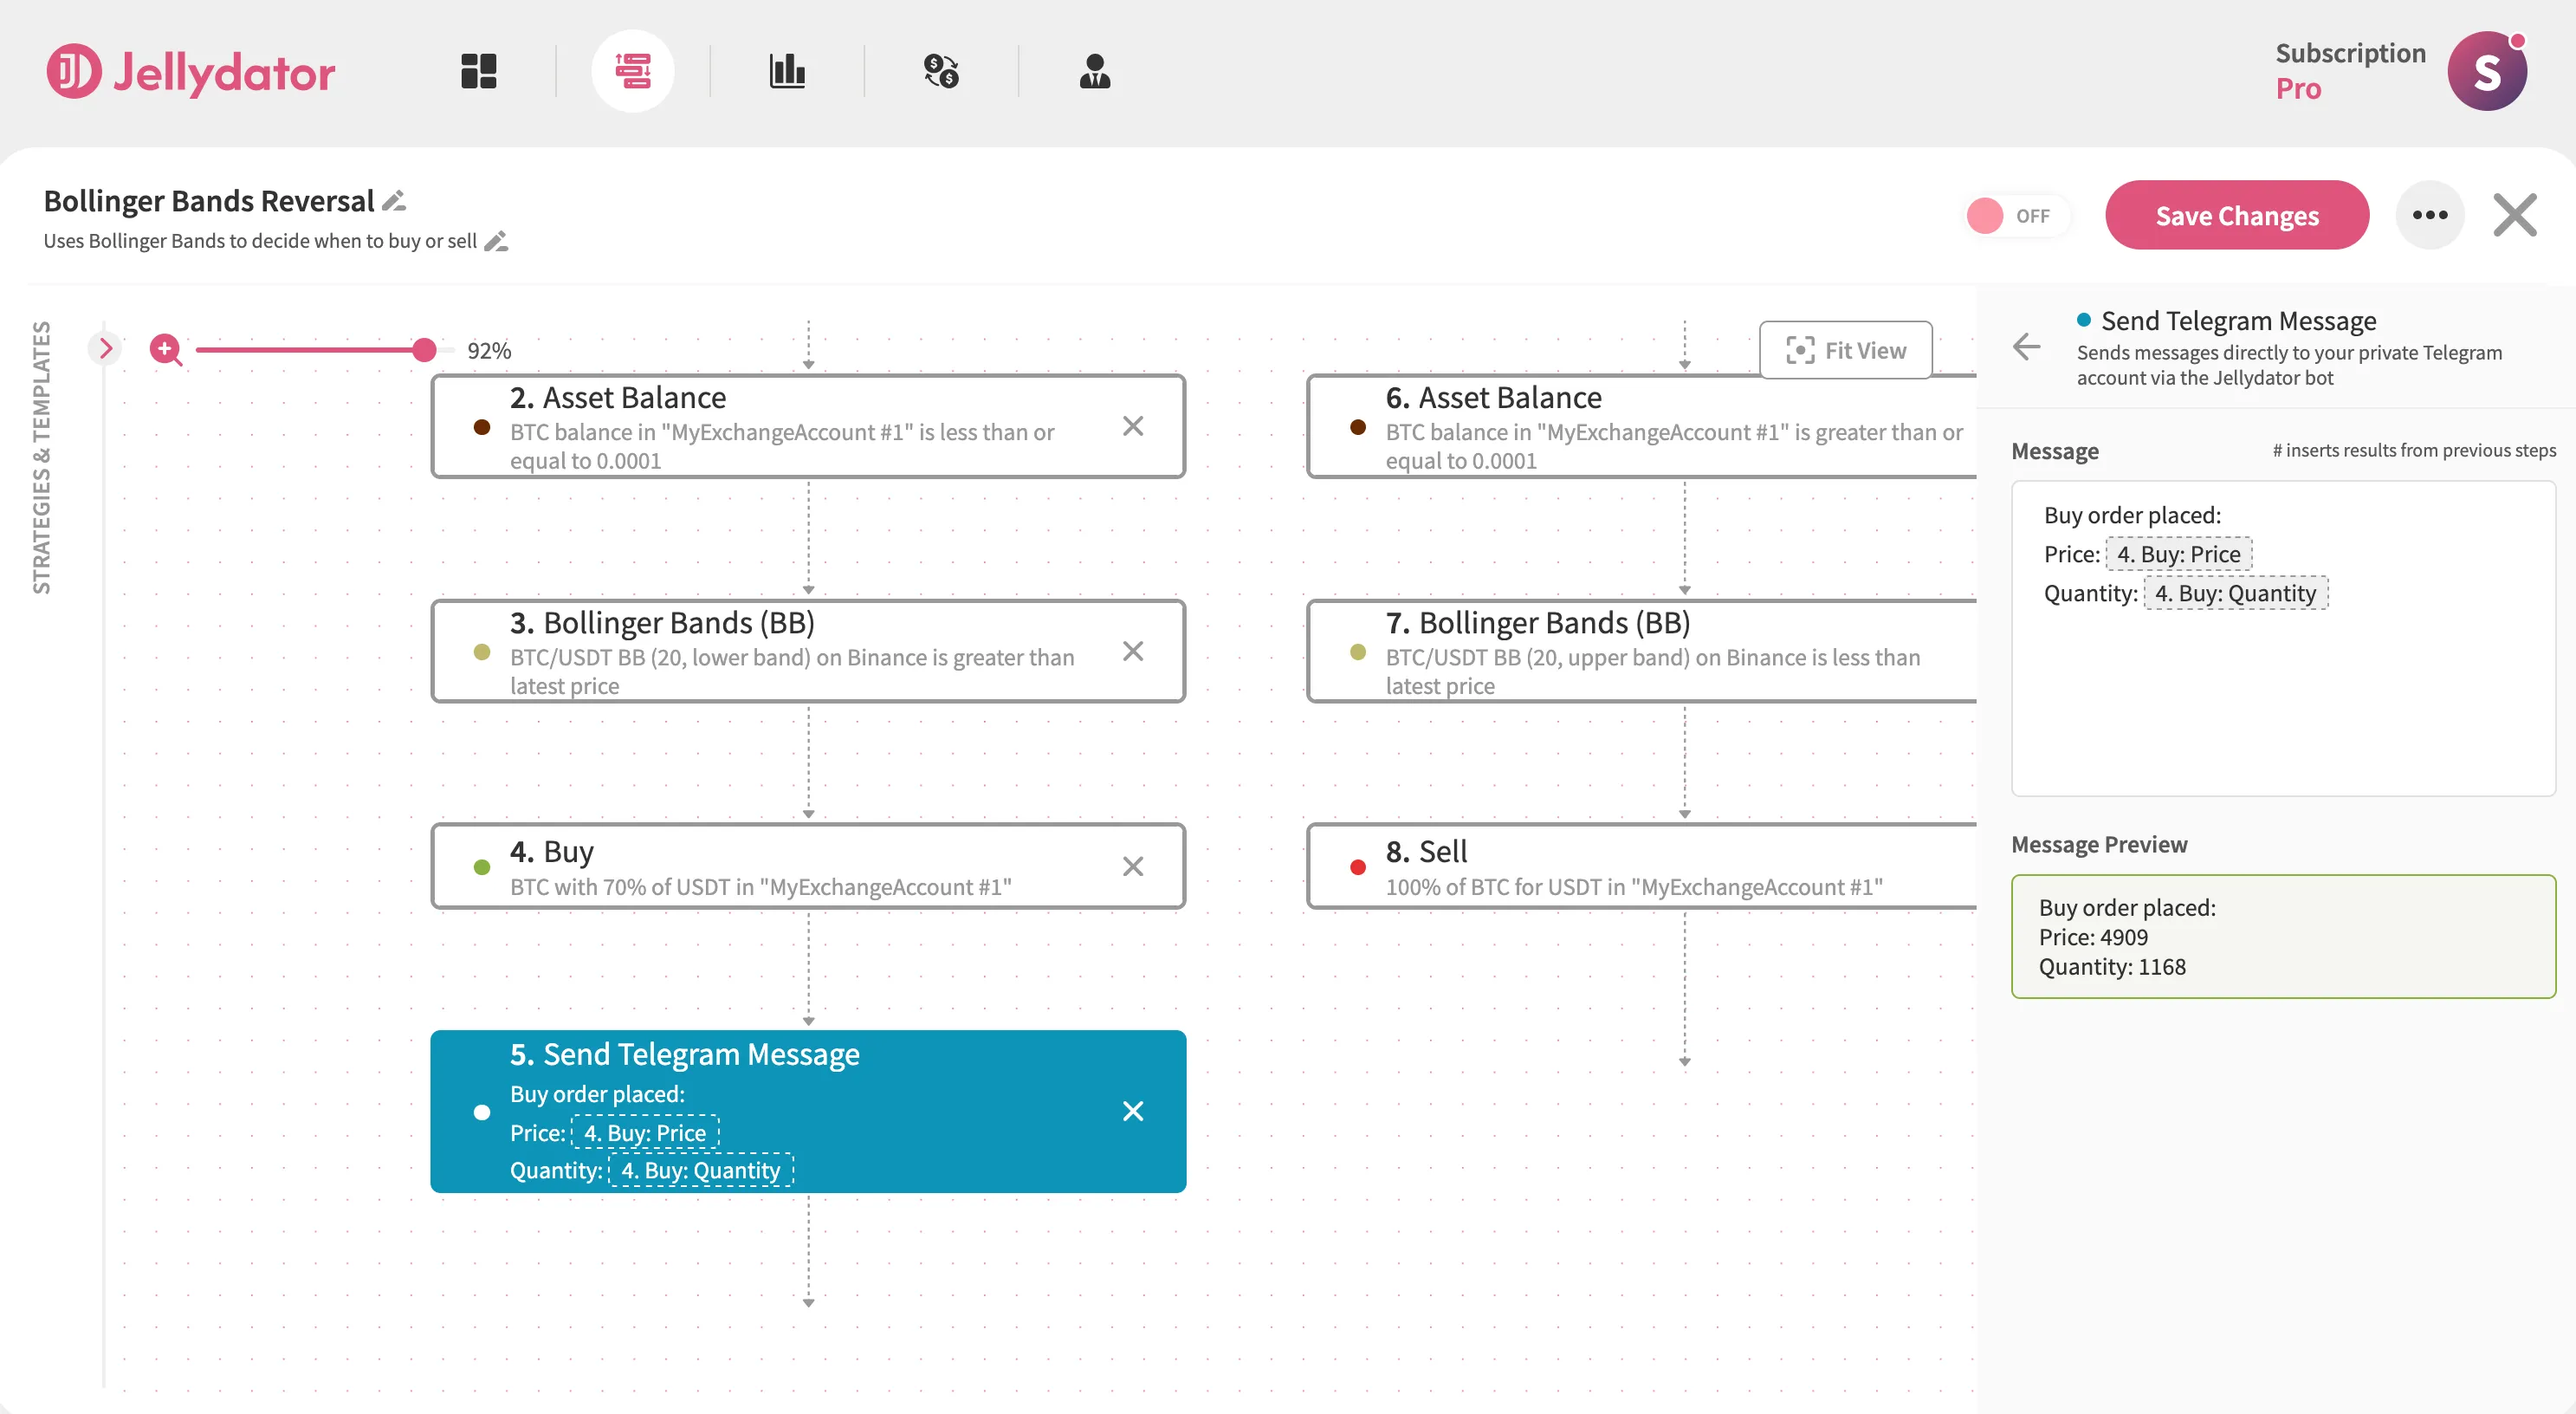
Stay Informed with Real-Time Alerts
Enhance your strategy by adding Telegram notifications to both paths. In Path A, include a Send Telegram Message step after your buy order. Customize it with a clear buy message like “Buy order placed.”
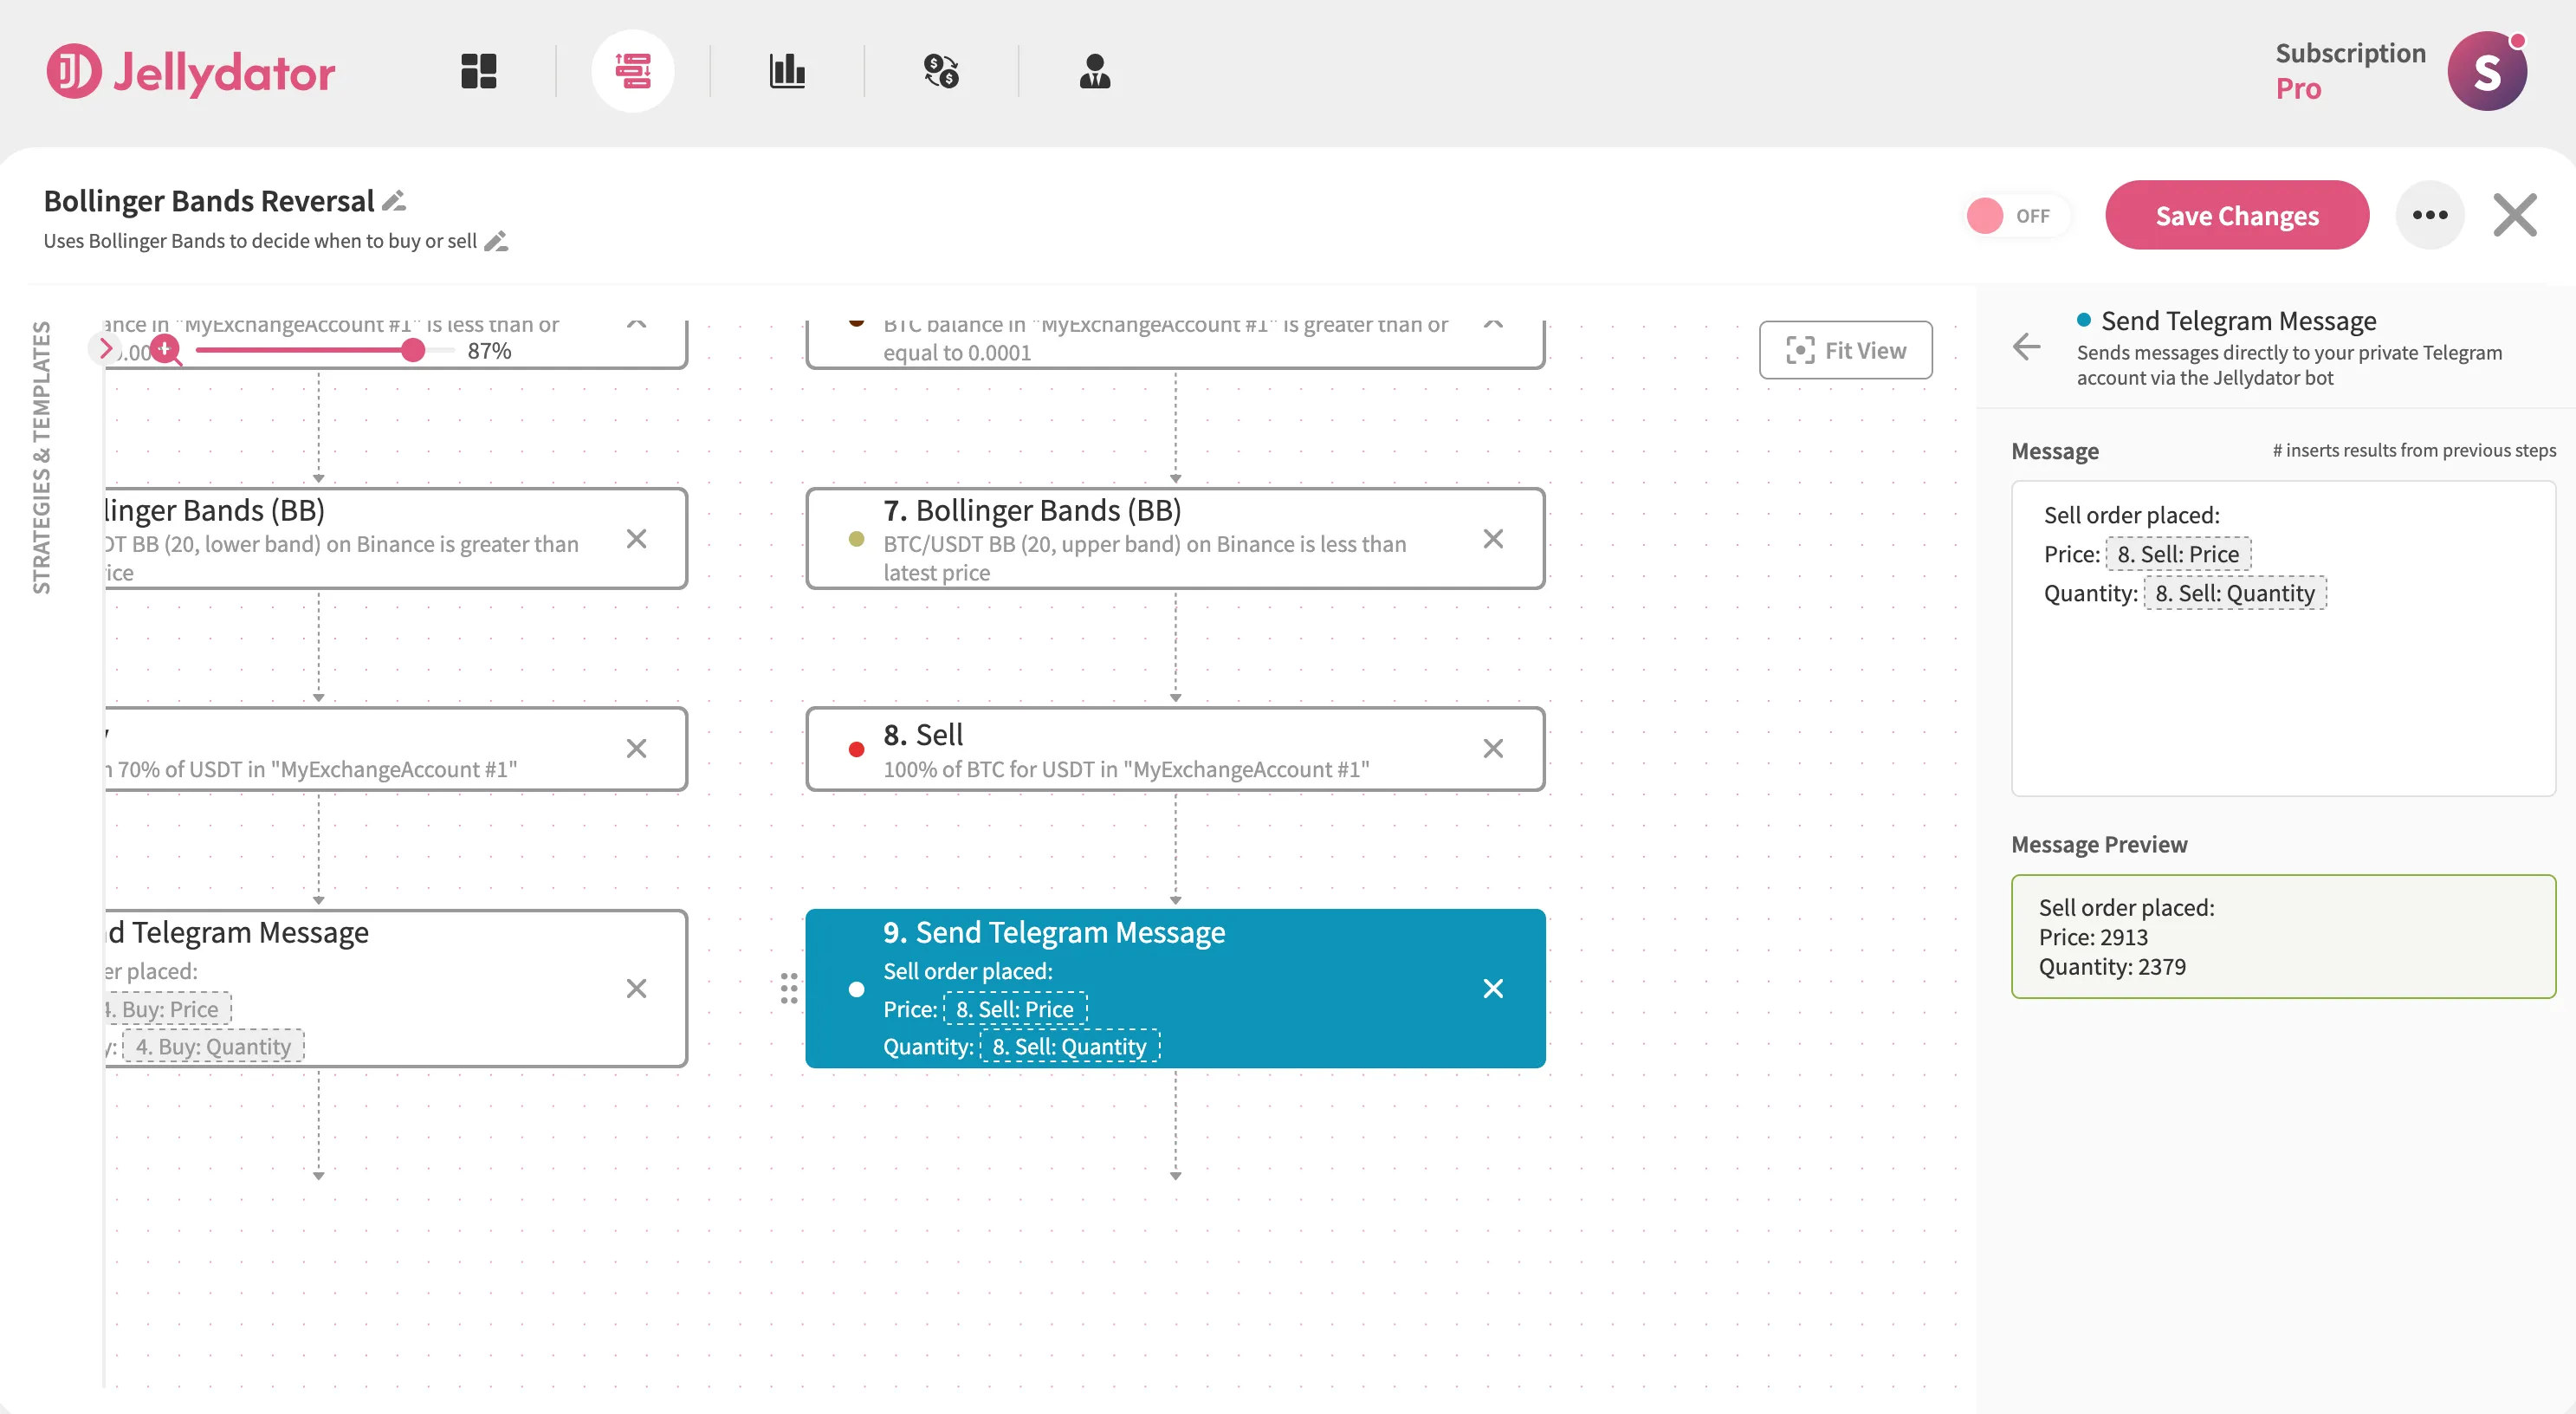
For Path B, place a similar message step after selling, using a phrase such as “Sell order placed.”
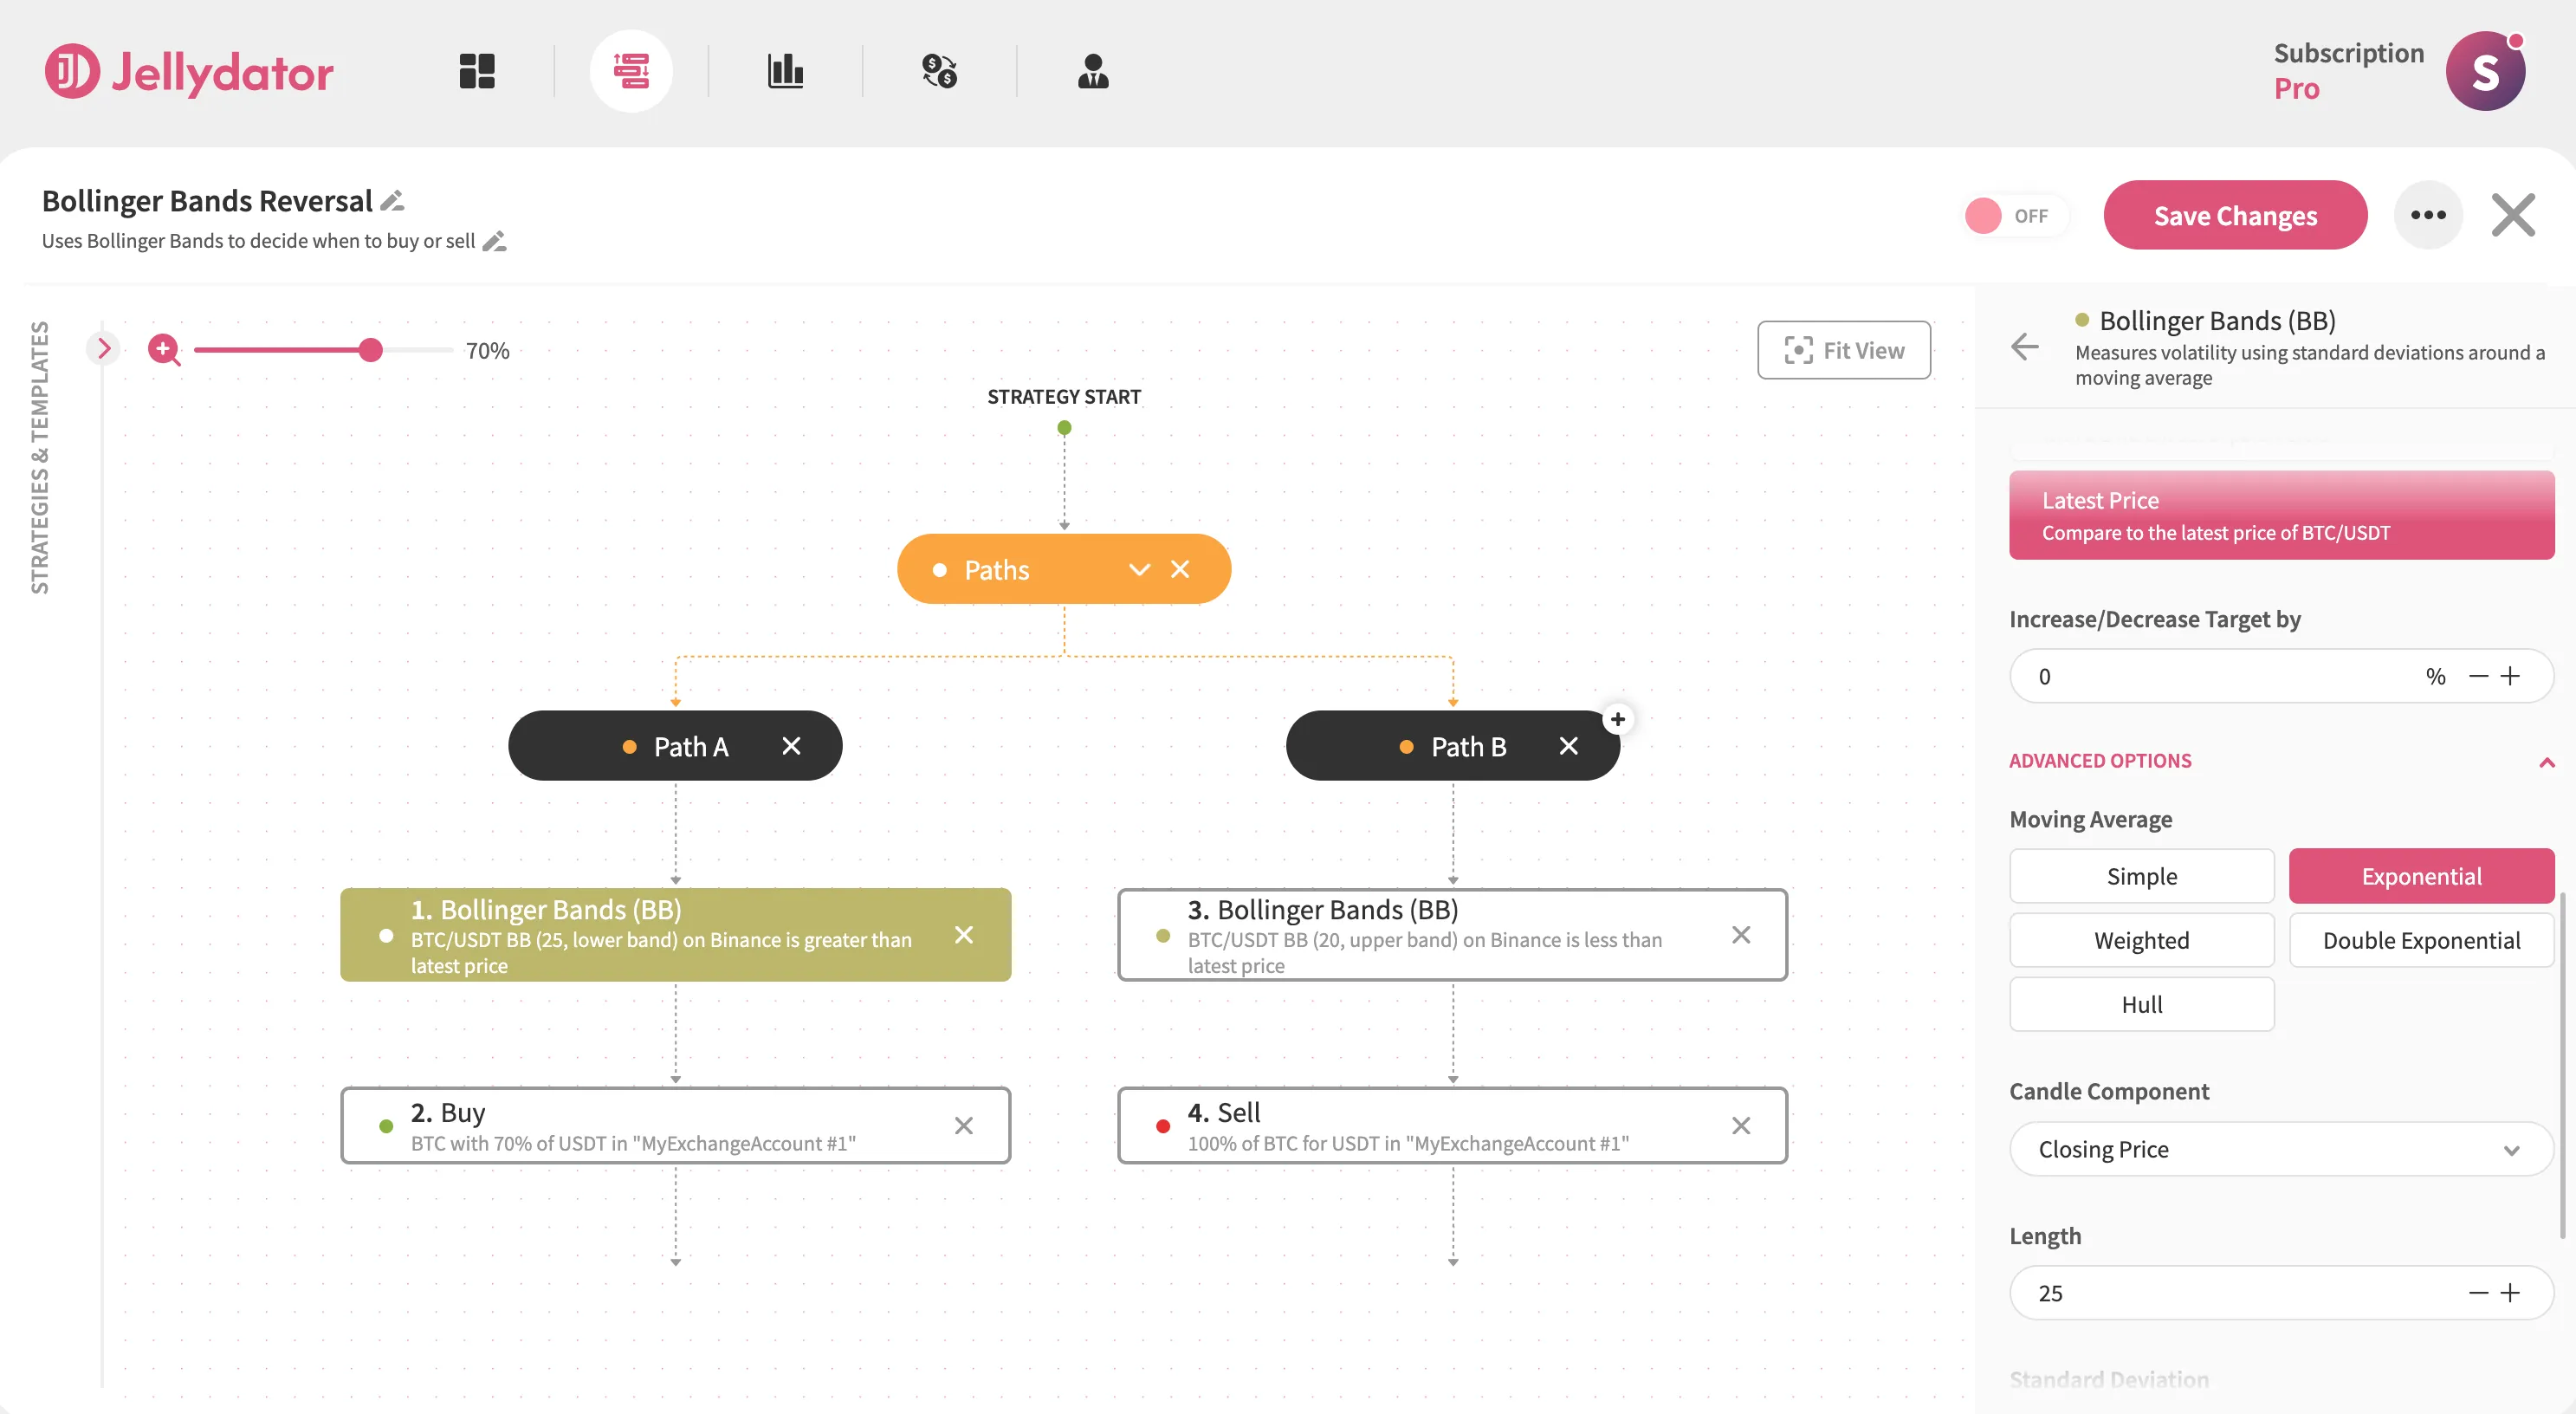
Adjust Bollinger Bands Settings
If you want to customize your strategy further, select any Bollinger Bands step and open “Advanced Options” in the configuration panel. Here you can modify the length (the default is 20) and switch between different moving average types. These changes help adapt the strategy to different market rhythms - shorter periods react faster to price changes, while longer ones provide smoother signals.
Conclusion
This Bollinger Bands strategy shines in fast-moving markets like crypto, giving both newcomers and seasoned traders an effective way to spot potential reversals. Its simplicity is its strength, which is like having a reliable compass in volatile conditions. But markets can test even the most reliable tools, which is why adding the Relative Strength Index (RSI) or social sentiment steps can help validate signals and enhance your strategy even more. With Jellydator’s drag-and-drop editor, adding these steps takes just minutes and turns a good strategy into one that adapts seamlessly to even the trickiest market conditions.