

Google is an everyday tool for millions, helping people find answers and validate their thoughts and emotions. This widespread usage makes Google search data a fascinating lens into collective sentiment, often revealing emerging trends that could influence various aspects of life and technology—like the dynamic crypto market. However, utilizing this data effectively requires overcoming certain challenges. In this article, we’ll dive into the origins of Google search data, explore how it can be harnessed to make smarter decisions, address the challenges of interpreting and applying this information, and demonstrate how overcoming these obstacles can refine automated trading systems in the volatile crypto market.
TLDR:
- Google Trends reveals patterns in search behavior that can signal upcoming changes in cryptocurrency prices.
- Bitcoin usually reacts quickly to search interest (often with 1-day lag), while Ethereum tends to respond more gradually (with up to 7-day lag); Dogecoin shows a notable correlation between search trends and price movements, driven by its meme-driven nature and sensitivity to public sentiment.
- Smaller cryptocurrencies and meme coins are highly sensitive to search trends, making Google Trends particularly useful for identifying opportunities in altcoin trading.
- Simple strategies like buying during rising search interest and selling during declines can be enhanced by combining Google Trends data with other tools like technical indicators or sentiment analysis.
- Platforms like Jellydator streamline the use of Google Trends for crypto trading by automating data tracking and trading actions, enabling more efficient strategy execution.
What is Google Trends
When people search for information online, they leave behind digital footprints that reveal collective interests and concerns. Google Trends captures these footprints, showing how search interest for specific terms evolves over time. For cryptocurrencies, these trends often mirror market sentiment and can even signal price movements before they occur.
For instance, between 2020 and 2021, Google searches for Bitcoin surged by approximately 150%, coinciding with its price climbing from around $7,200 to over $64,000. Similarly, during the explosive 2016-2017 bull run, Bitcoin’s search interest skyrocketed by 1200%, aligning with a price jump from $1,000 to nearly $20,000.
These examples highlight Bitcoin’s unique connection to search trends as the most prominent crypto asset. But how do other cryptocurrencies respond to changes in search interest?

Search Trends Affect Cryptocurrencies in Different Ways
To determine how accurately cryptocurrencies react to search interest, researchers and traders analyze something called “optimal correlation.” This metric measures how strongly changes in Google search trends are linked to price movements and identifies the time lag at which this relationship is most evident. In simpler terms, it shows how well search data can predict price changes and how quickly the market responds. A higher correlation value (closer to 1) signals a stronger connection between search trends and price behavior.
In a recent analysis of Google Trends data, several cryptocurrencies representing distinct market dynamics were compared. As mentioned earlier, Bitcoin demonstrates a clear connection to its search interest. The analysis found that Bitcoin’s price has an optimal correlation of 0.34 with search trends at a one-day lag, meaning about 11.56% of its price variability can be attributed to changes in public interest. This relatively quick reaction highlights Bitcoin’s status as the most prominent and widely followed cryptocurrency.
Ethereum, however, shows a slightly weaker connection, with a correlation coefficient of around 0.28. This means that approximately 7.84% of Ethereum’s price movements can be explained by shifts in Google search activity. Interestingly, this relationship becomes more noticeable during major events like network upgrades or periods of heightened DeFi activity, reflecting Ethereum’s role as a hub for innovation within the crypto space.
Dogecoin, by contrast, exhibits the strongest correlation among the three, with a coefficient of 0.59. This suggests that nearly 35% of Dogecoin’s price movements are influenced by changes in search interest. Its high sensitivity to public attention likely stems from its meme coin identity, where social media buzz and viral trends play an essential role in driving market activity.
Similarly, emerging cryptocurrencies appear to be even more reactive to shifts in search interest. For instance, projects like Ocean Protocol and SingularityNET have shown notably high correlations with Google search activity, particularly within a week of shifts in public interest. While these assets haven’t been studied as extensively as Bitcoin, Ethereum, or Dogecoin, preliminary observations suggest that smaller market-cap cryptocurrencies are highly reactive to changes in attention. This makes Google Trends a valuable tool for traders focused on altcoins, where public sentiment can play a pivotal role in driving price movements.
Time Lags Between Searches and Price Movements
One important factor to consider when using Google Trends data for trading is the time lag between spikes in search interest and corresponding price movements. It varies across cryptocurrencies, revealing unique market dynamics:
- Bitcoin shows the strongest correlation with just a one-day lag, indicating that its market reacts swiftly to changes in public attention.
- Ethereum exhibits an optimal lag of seven days, which reflects its many use cases and diverse investor base, leading to slower price responses compared to Bitcoin.
- Dogecoin also demonstrates a significant correlation with a one-day lag, highlighting its reliance on social sentiment and the rapid reactions of retail investors typical of meme coins.
Think of “time lag” as the delay between when public interest shifts and when that shift is reflected in price movements. For example, Bitcoin’s one-day lag means that shifts in search interest today will most likely be reflected in its price by tomorrow. Similarly, Ethereum’s seven-day lag suggests that it takes about a week for changes in search behavior to influence its market performance.
Recognizing these timing differences is essential when developing effective trading strategies. By analyzing search interest trends alongside other data, such as sentiment metrics or technical indicators, traders can refine their strategies and execute well-timed decisions ahead of market reactions.
Simple Trading Strategies Using Google Trends
A simple yet effective trading strategy using Google Trends involves tracking changes in search interest for terms like “bitcoin”:
- Buy when the relative change in Google Trends data is positive.
- Sell when the relative change is negative.
This strategy works on the assumption that rising search interest reflects growing public sentiment and potential price increases, while declining interest may signal a drop in demand or price.
How to Implement This Yourself
There are a few ways to put this strategy into practice:
- Manual Tracking: You could monitor search trends manually on platforms like Google Trends, but this requires constant attention and effort.
- Custom Scripts: Another option is to develop your own script or use
existing ones, such as those available on GitHub. However, this approach
comes with challenges:
- You’d need to maintain the script yourself or rely on someone else to do it.
- Accessing Google Trends data programmatically often involves high fees.
How to Implement This on Jellydator
With Jellydator, implementing this strategy becomes seamless and cost-effective. Here’s how you can set it up:
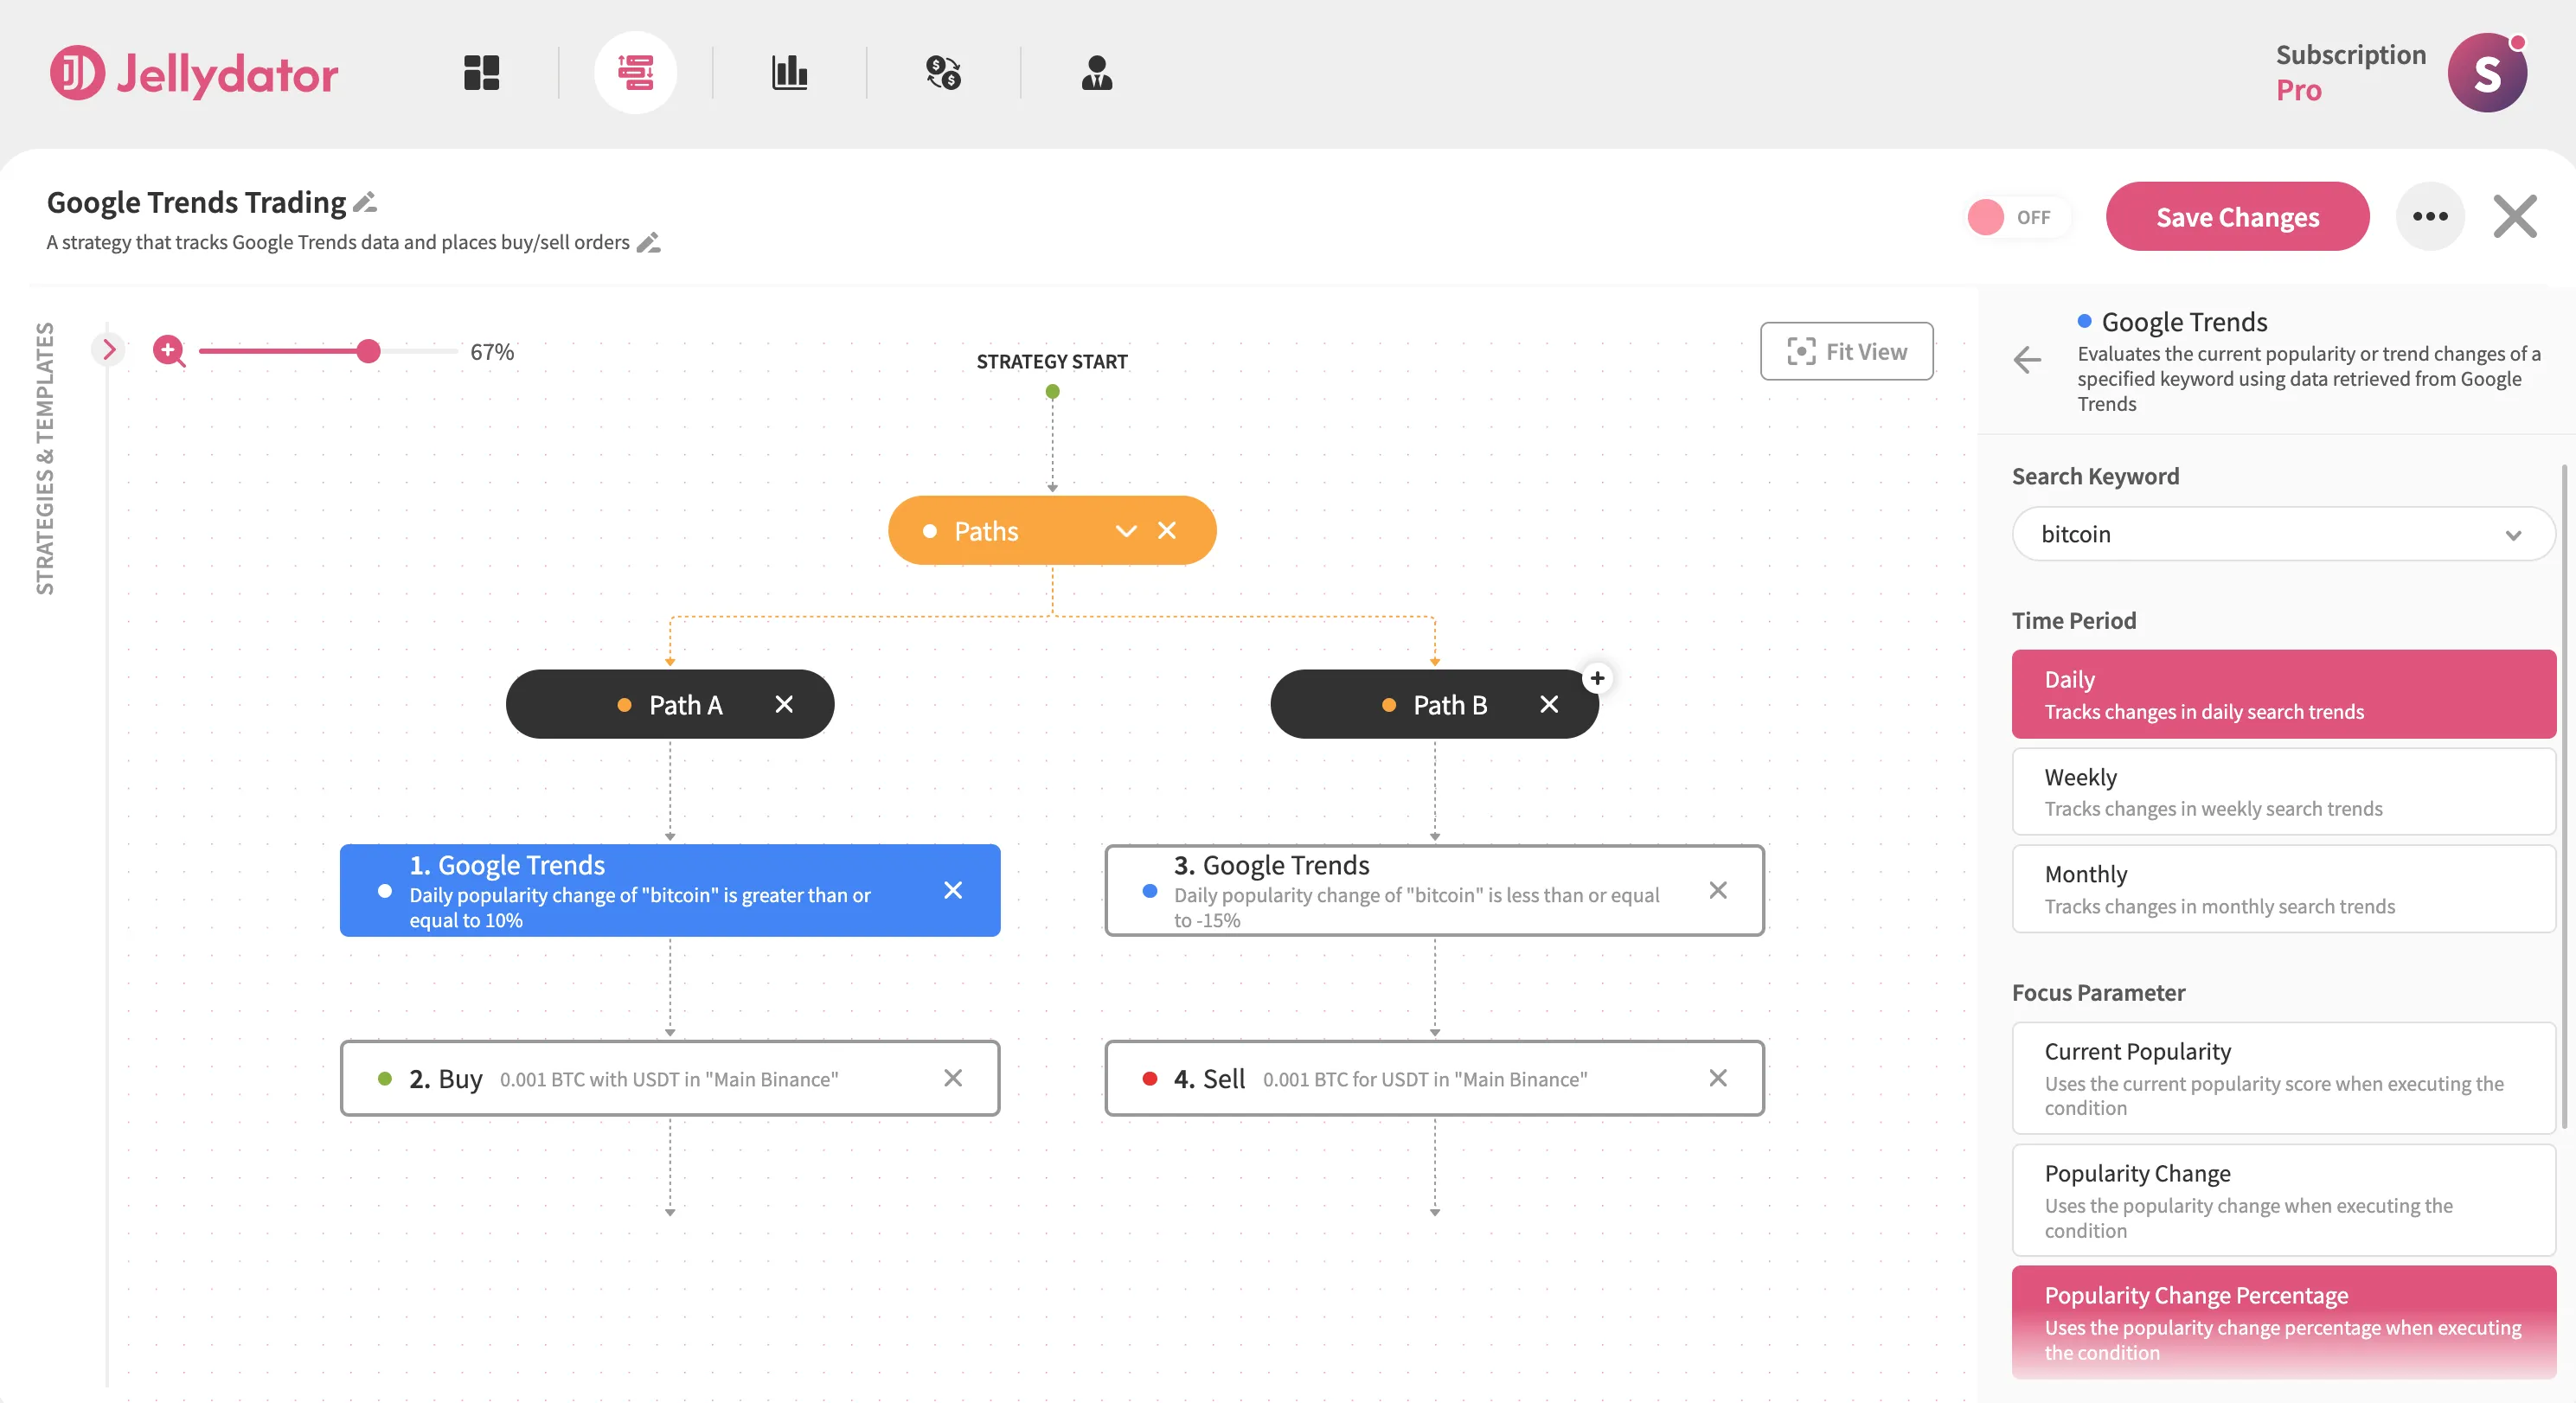
- Add a Google Trends strategy step and select “bitcoin” as your target keyword. Use the “daily” time period and choose the “popularity change percentage” option to track daily relative changes in the keyword’s popularity.
- Create two strategy branches (also known as Paths): one for when popularity increases and another for when it decreases.
- Add Buy and Sell steps to their respective branches to automate actions based on the tracked changes.
Additional Tips
- Focus on Relative Changes, Not Absolute Values
Pay attention to how search interest is shifting rather than the raw numbers. Even a slight increase from a low starting point can indicate growing momentum and potential market movement. - Combine Google Trends With Other Indicators
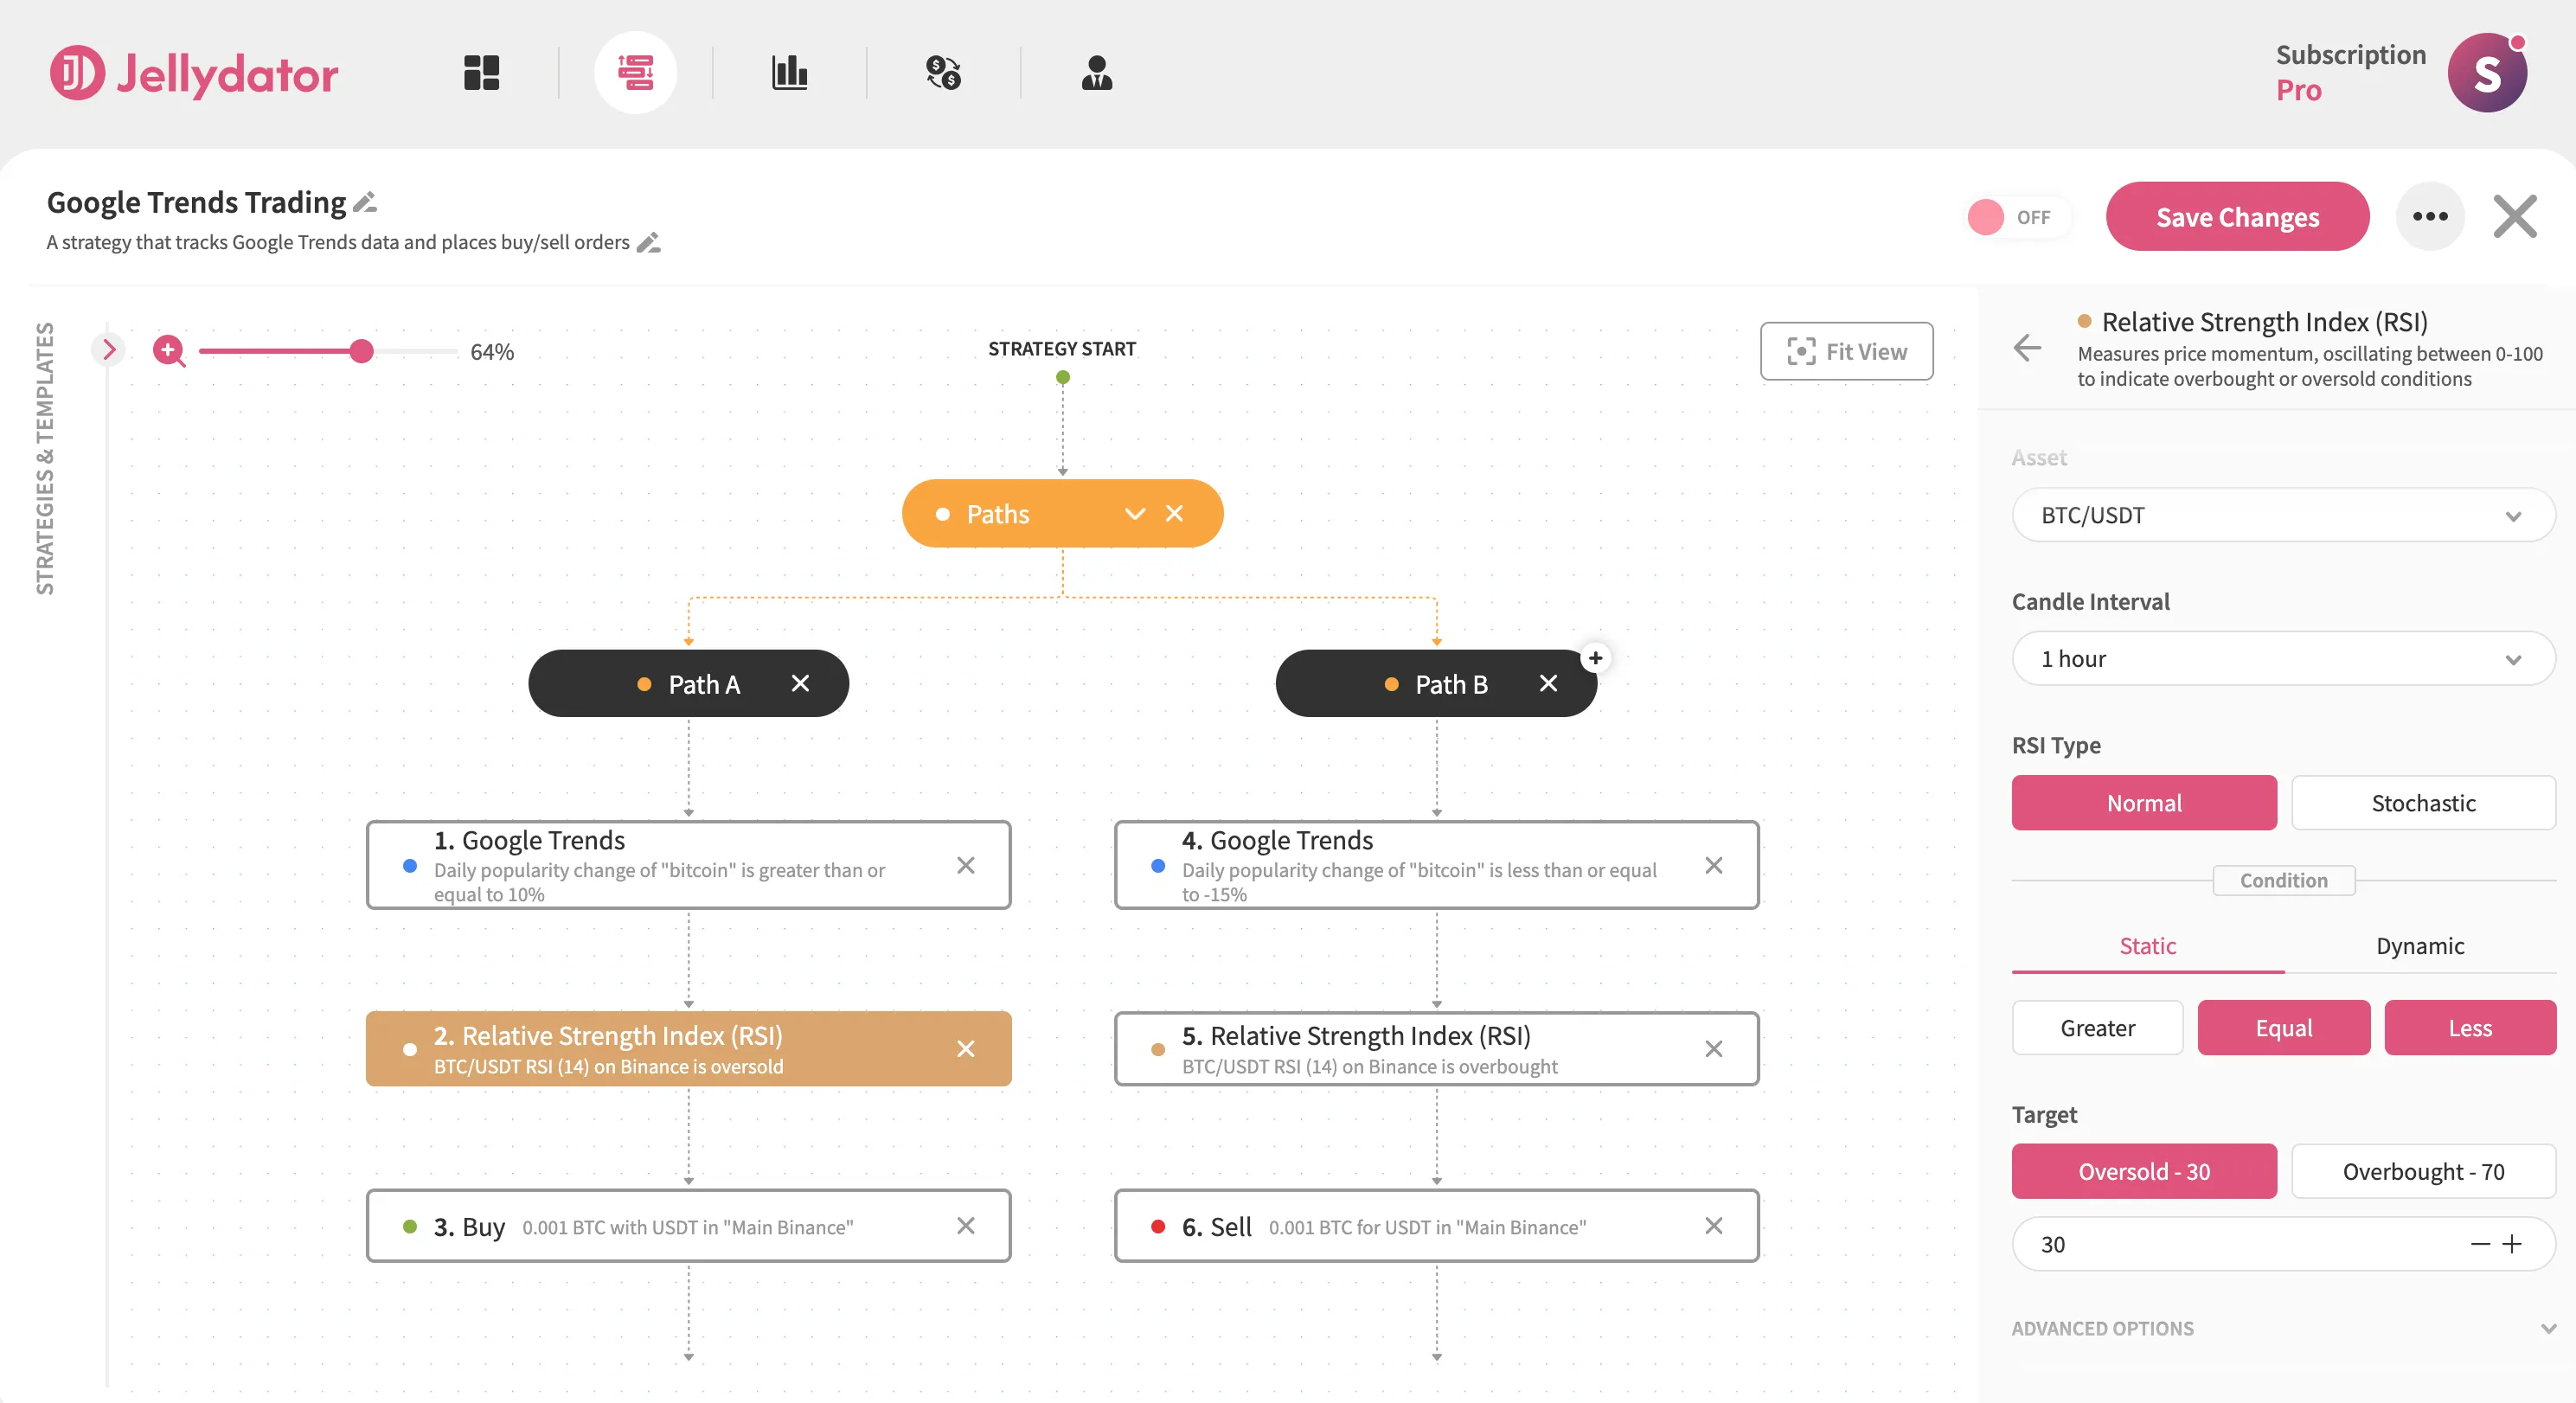
Google Trends data becomes far more effective when paired with other analysis tools. For example, technical indicators like the Relative Strength Index (RSI) can validate signals from search trends. With Jellydator, you can easily combine these tools into a single strategy:
- Adapt to Market Conditions
The effectiveness of Google Trends as a predictive tool depends on market circumstances. During times of significant market fluctuations or important news developments, the correlation between search interest and price movements may become unpredictable. To gain an edge, consider using Jellydator’s social analysis steps to understand the broader market context better. - Test Strategies Using a Paper Exchange
Before committing to real trades, try out your strategies on a paper exchange. This allows you to observe how the market reacts without risking actual funds, helping you refine your approach. - Track Google Trends of Altcoins and Meme Coins
When it comes to smaller tokens or meme coins, monitoring search interest can be especially valuable. These assets tend to be highly reactive to public attention, making Google Trends an excellent tool for identifying opportunities in this space.
Conclusion
Google Trends offers crypto traders valuable insights into market sentiment and its influence on price movements, particularly for assets like Dogecoin and other altcoins, where public interest plays a crucial role. By analyzing search trends and time lags, traders can identify patterns that may help refine their strategies, especially when combined with tools focused on social sentiment and technical analysis. This process can be simplified significantly with platforms like Jellydator, which streamline access to Google Trends data and automate responses, allowing traders to concentrate on strategy development. Finally, it’s worth remembering that as the crypto market continues to evolve, the volume of data will keep increasing as well, so leveraging tools to quickly and efficiently interpret public sentiment will remain a critical advantage for successful trading.