

The Golden Cross and Death Cross are two of the most well-known moving average crossover signals in technical analysis. You’ll often hear traders talk about them when markets start to make big moves. The Golden Cross pops up when a short-term moving average climbs above a long-term one. This usually gets people excited about a possible uptrend and hints that it might be a good time to buy. On the flip side, the Death Cross shows up when that short-term average drops below the long-term average, which many see as a warning sign that the market could turn bearish and that it might be a good time to sell or lock in profits.
Since these two signals are like mirror images, they work perfectly together in a single strategy. By combining them, we can create a straightforward trading plan: buy when we spot a Golden Cross and sell when a Death Cross appears. So, in this guide, we’ll walk you through the entire process of setting up this strategy from start to finish.
How The Strategy Works
The combined Golden Cross and Death Cross strategy follows a few simple rules.
First, it waits for a Golden Cross. As already established, this happens when a short-term simple moving average — most often the 50-day — crosses above a long-term simple moving average, like the 200-day. This crossover signals a possible shift to a bullish trend and tells the strategy to place a buy order.
Once the buy order is filled, the focus shifts to spotting a Death Cross. This is the opposite signal: the short-term average (again, typically the 50-day) needs to drop below the long-term average (usually the 200-day). This signals a possible start of a bearish trend and prompts the strategy to place a sell order.
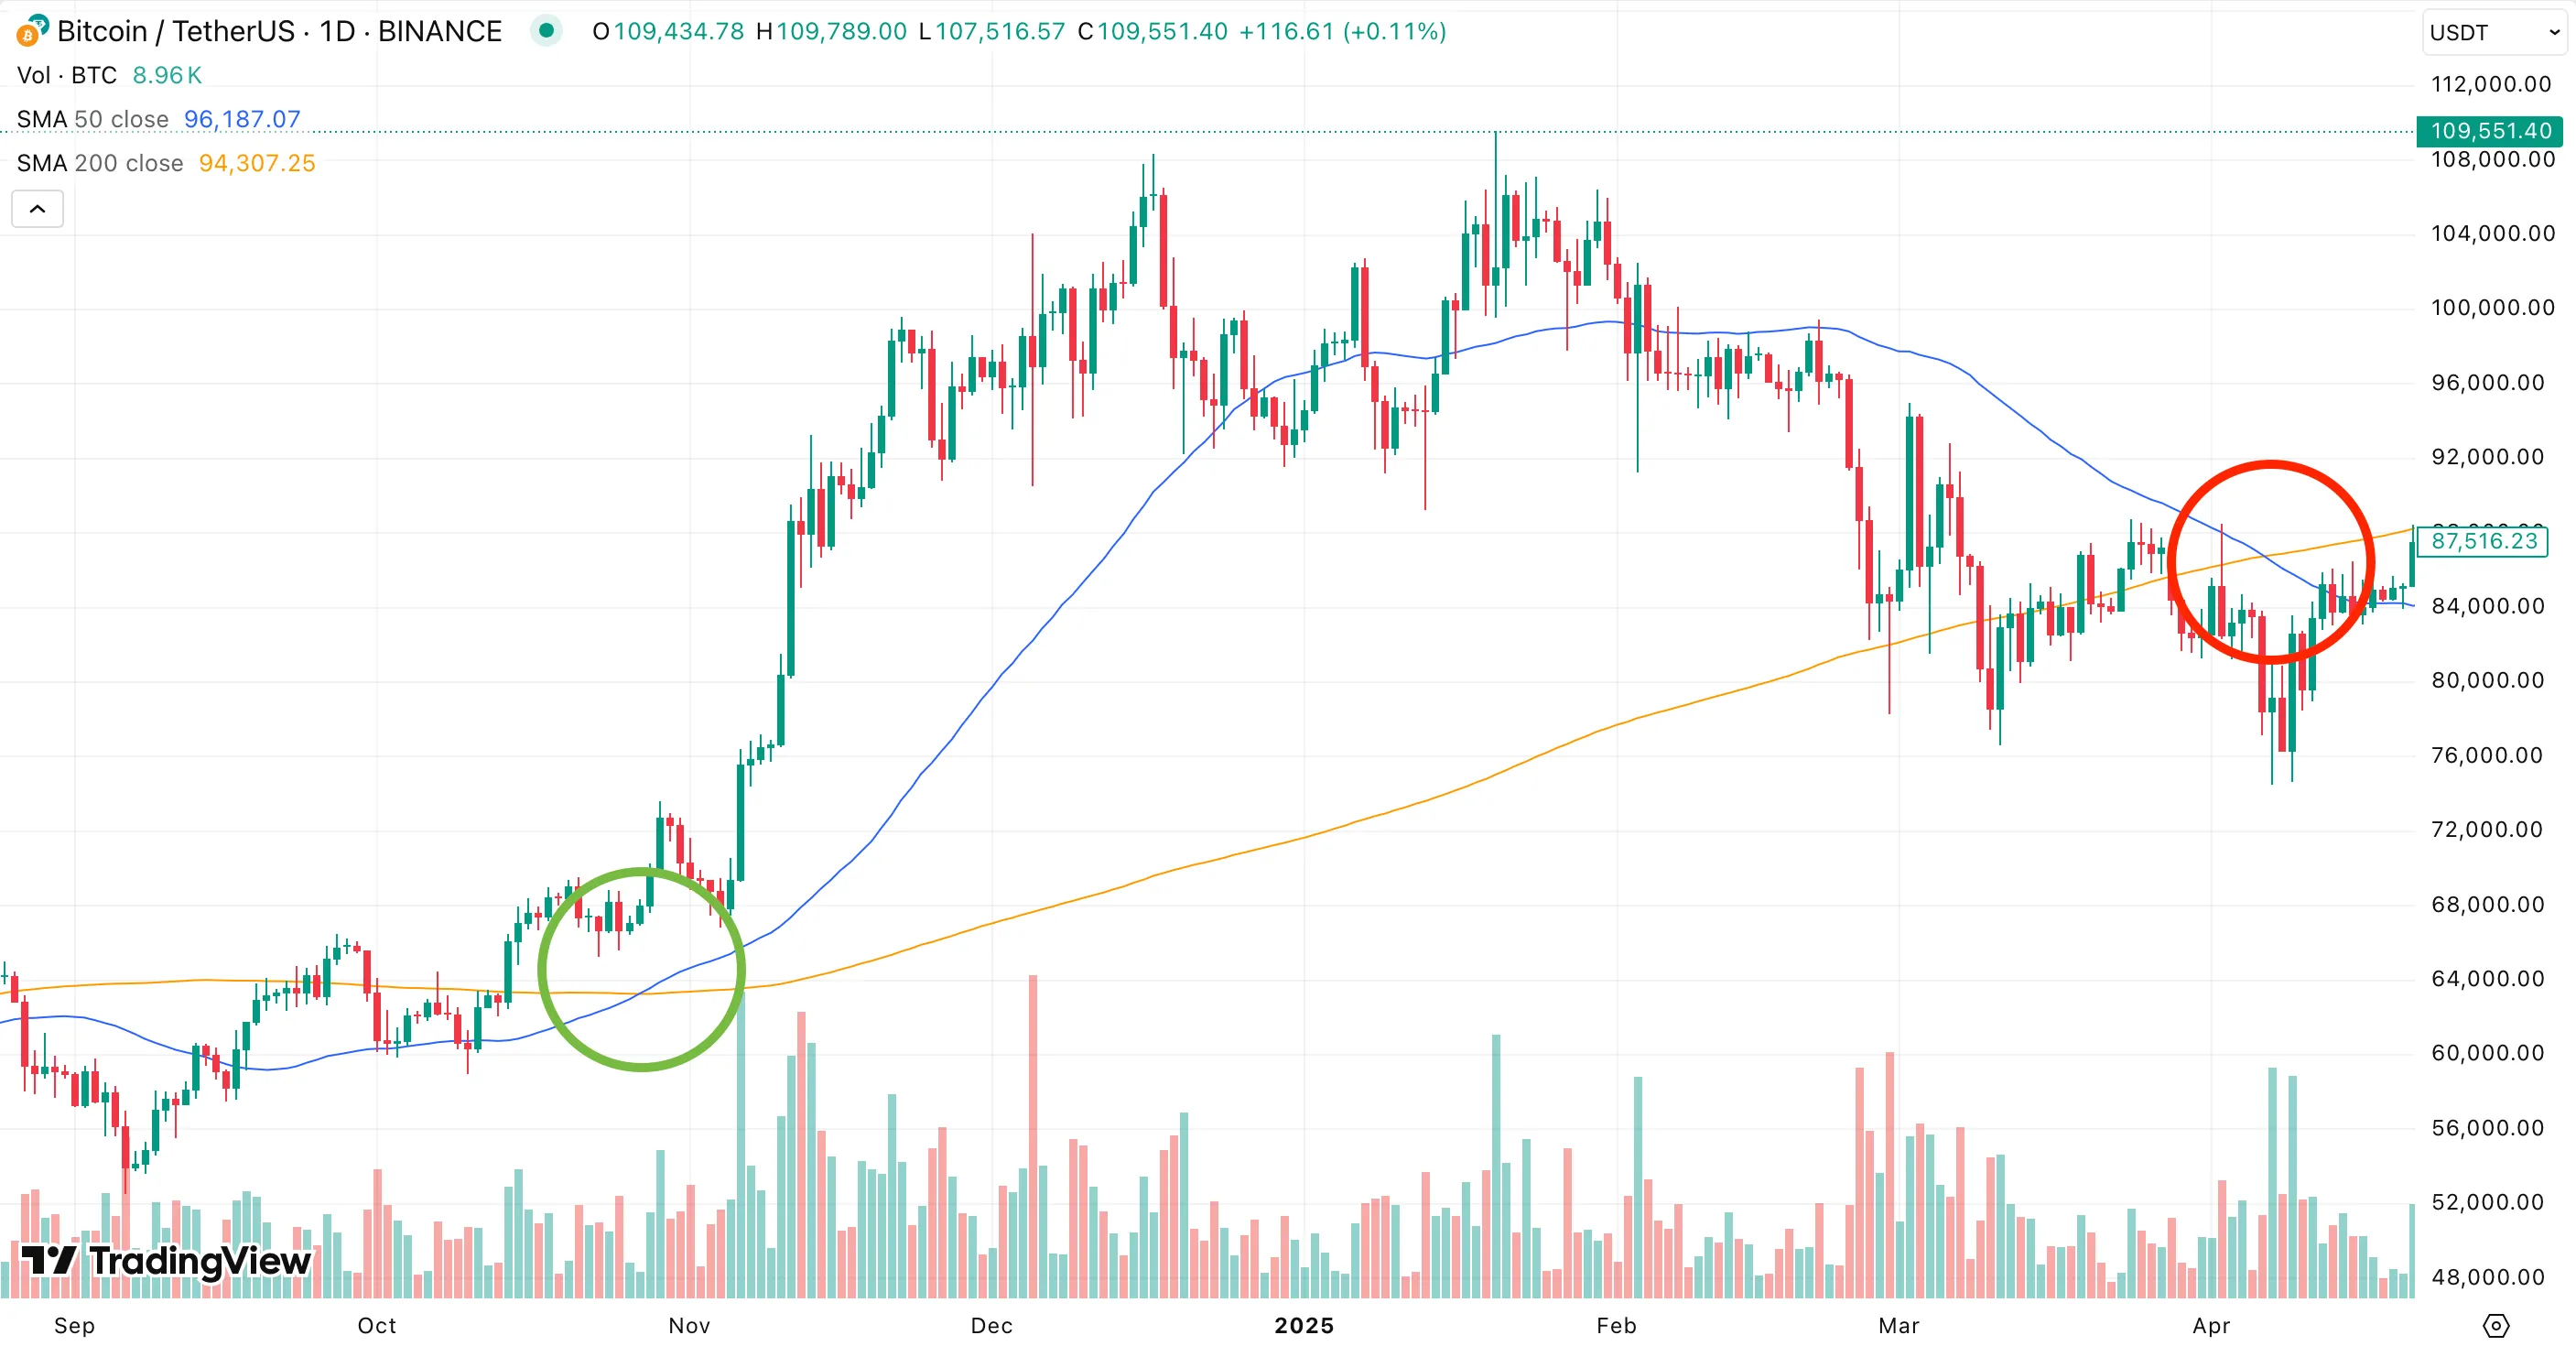
For a visual example, look at the BTC/USDT chart below. The green marker shows where the strategy would buy as the short-term average rises above the long-term average. The red marker shows the sell point, where the short-term average drops below the long-term average.
How to Build It on Jellydator
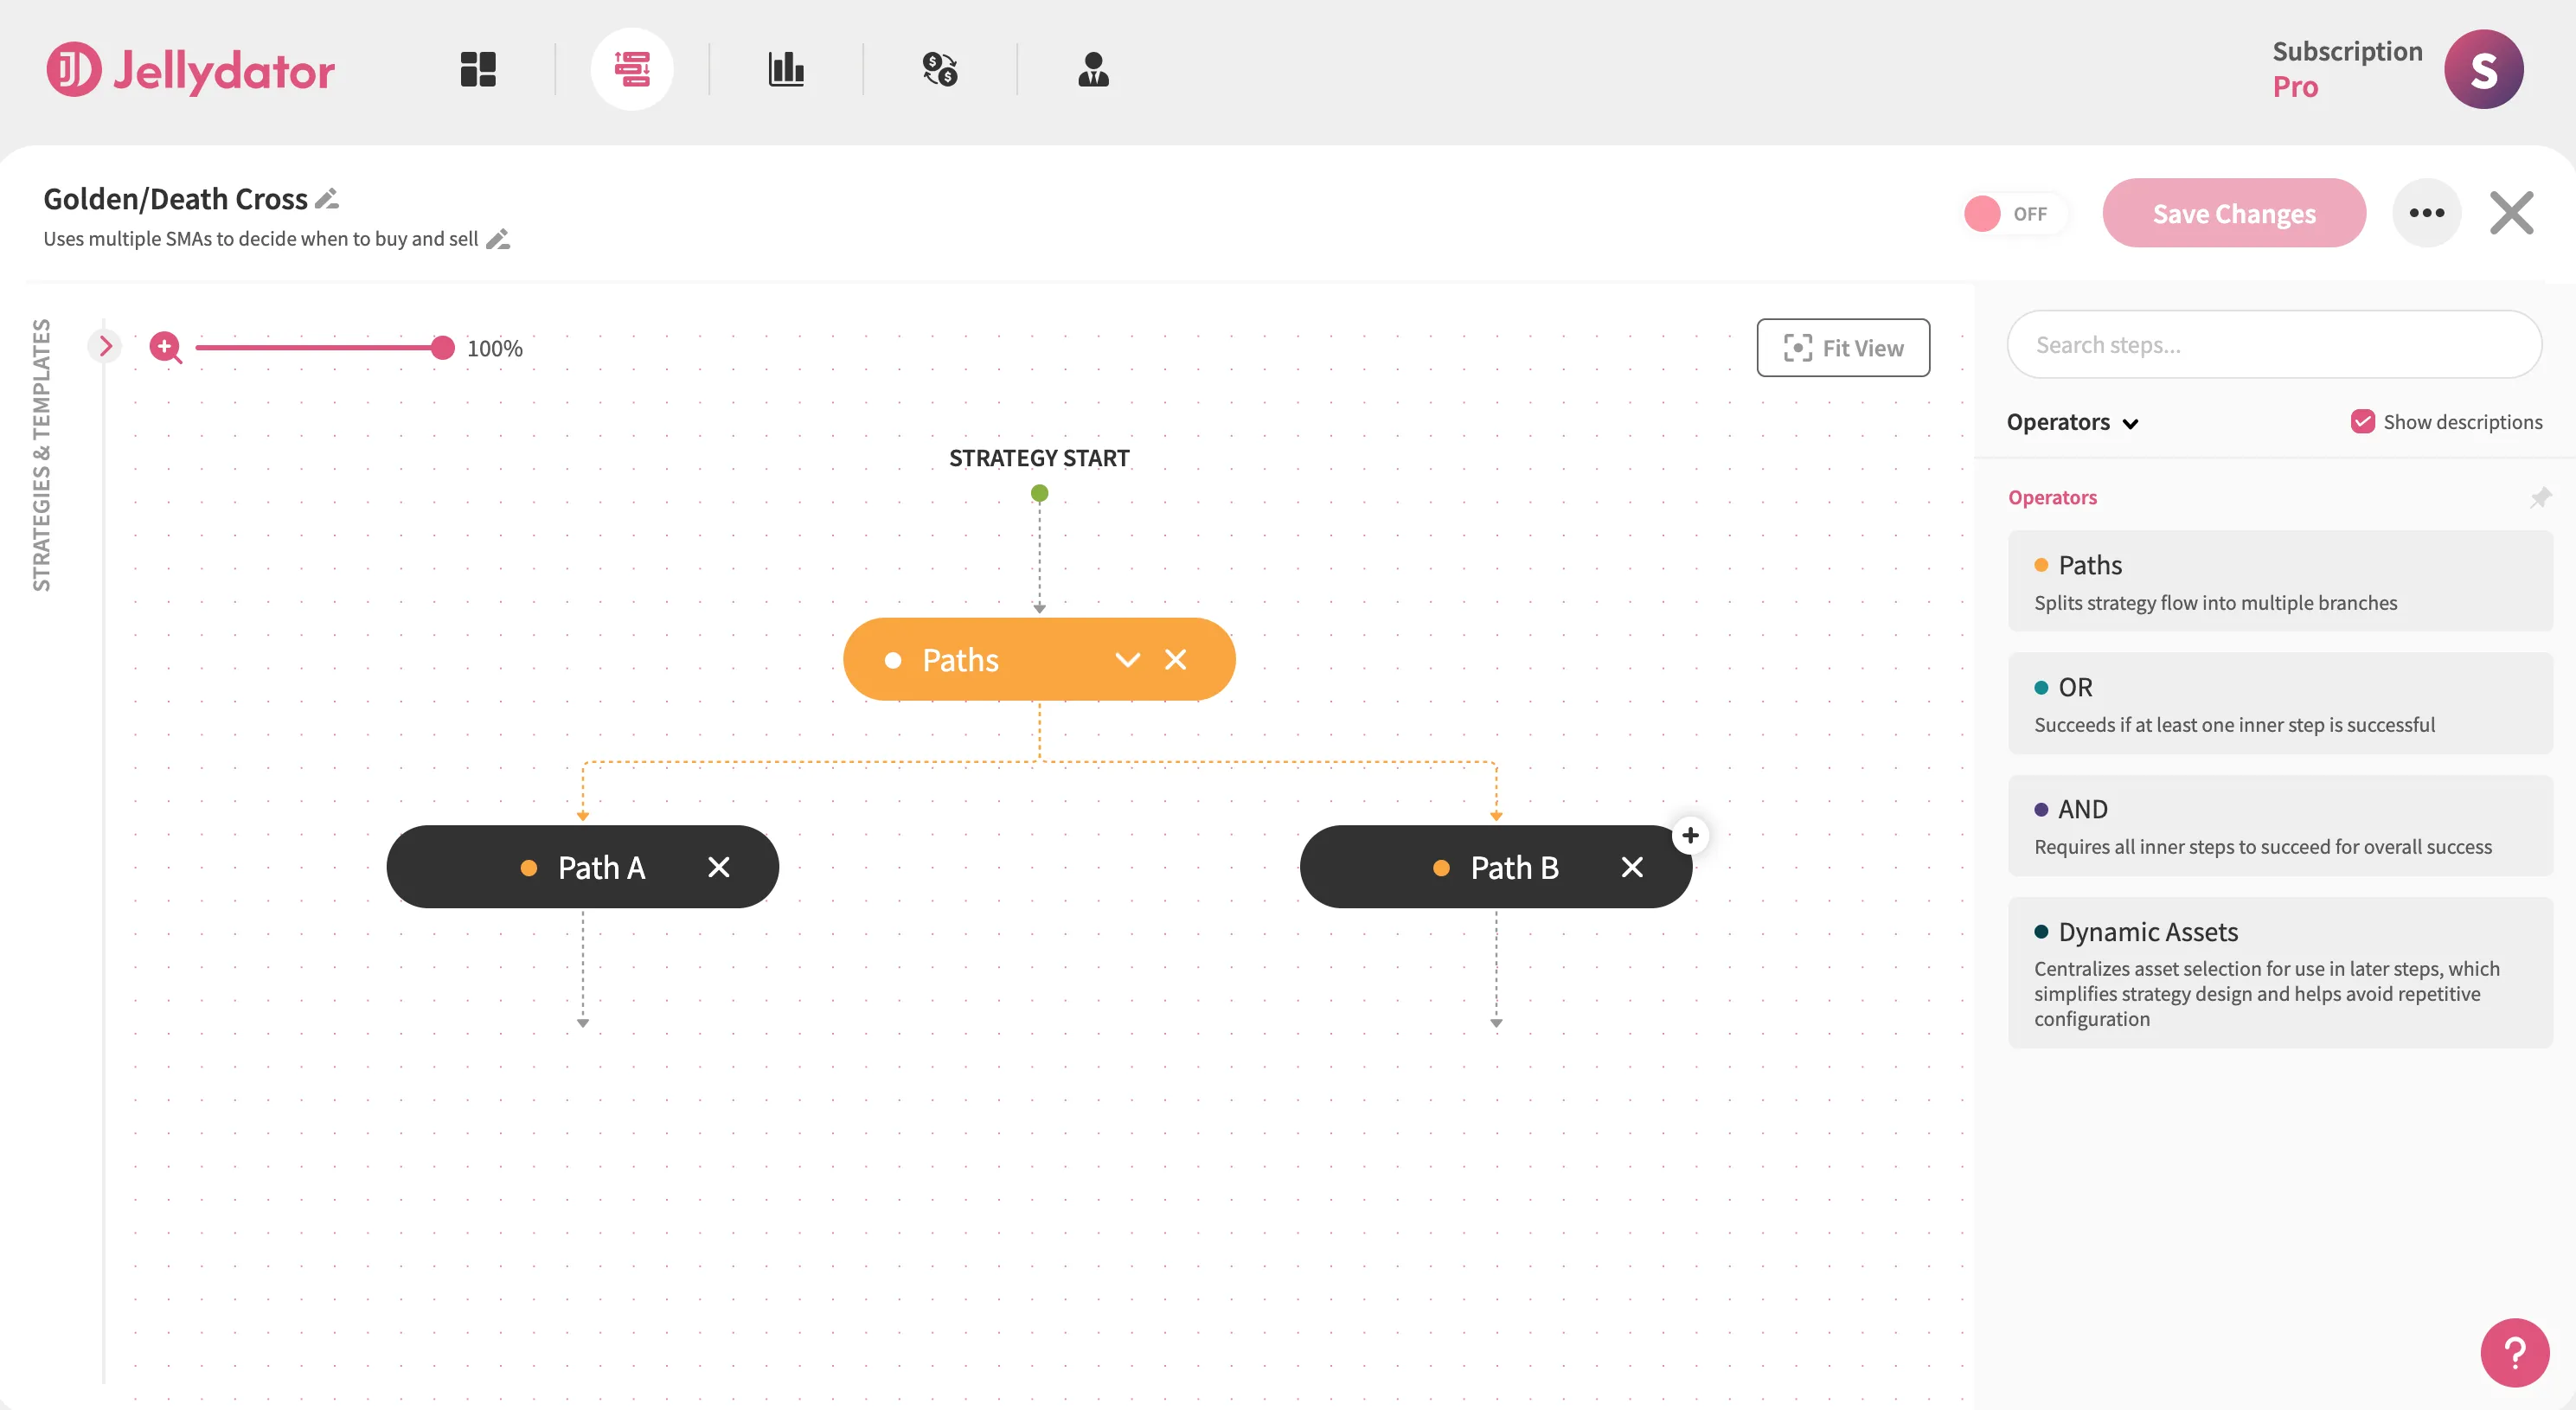
Start by adding a Paths step to your Jellydator editor. This creates two parallel decision paths for your strategy.
Path A Configuration
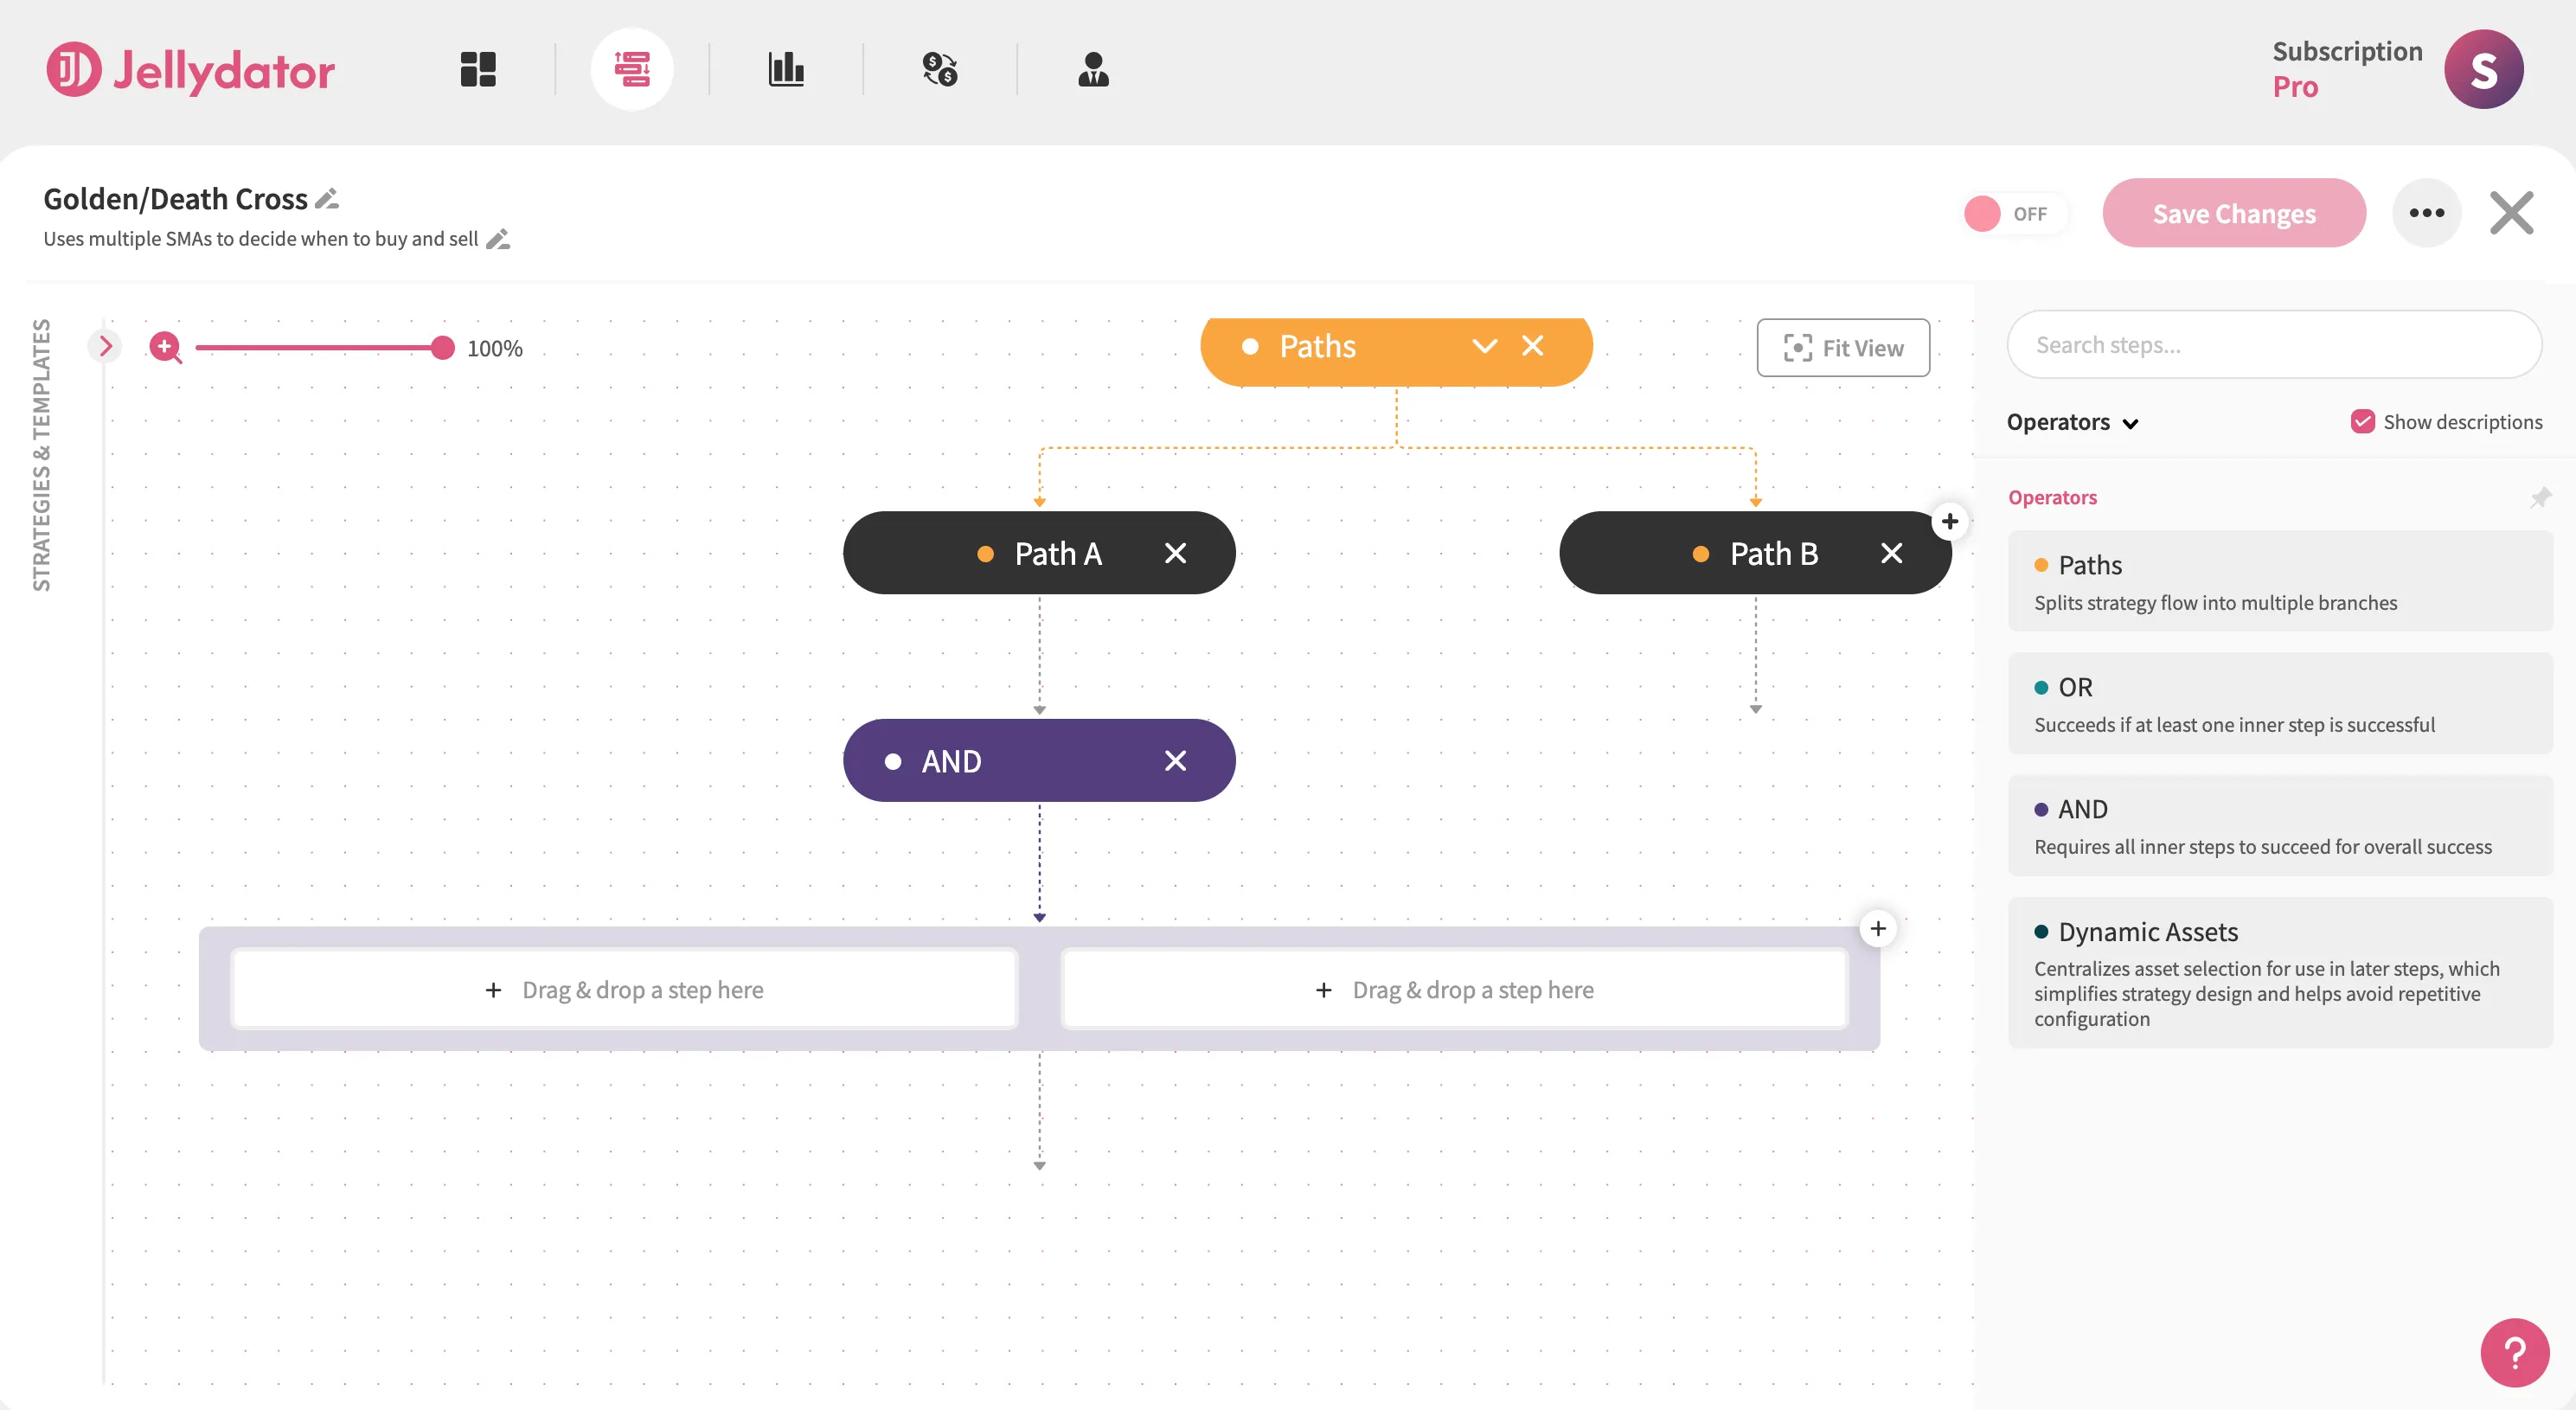
Path A will be used to spot the Golden Cross. In it, add an AND step. It will be used to group two Moving Average steps. Grouping like this makes the strategy more readable, which is especially useful when strategies become quite large.
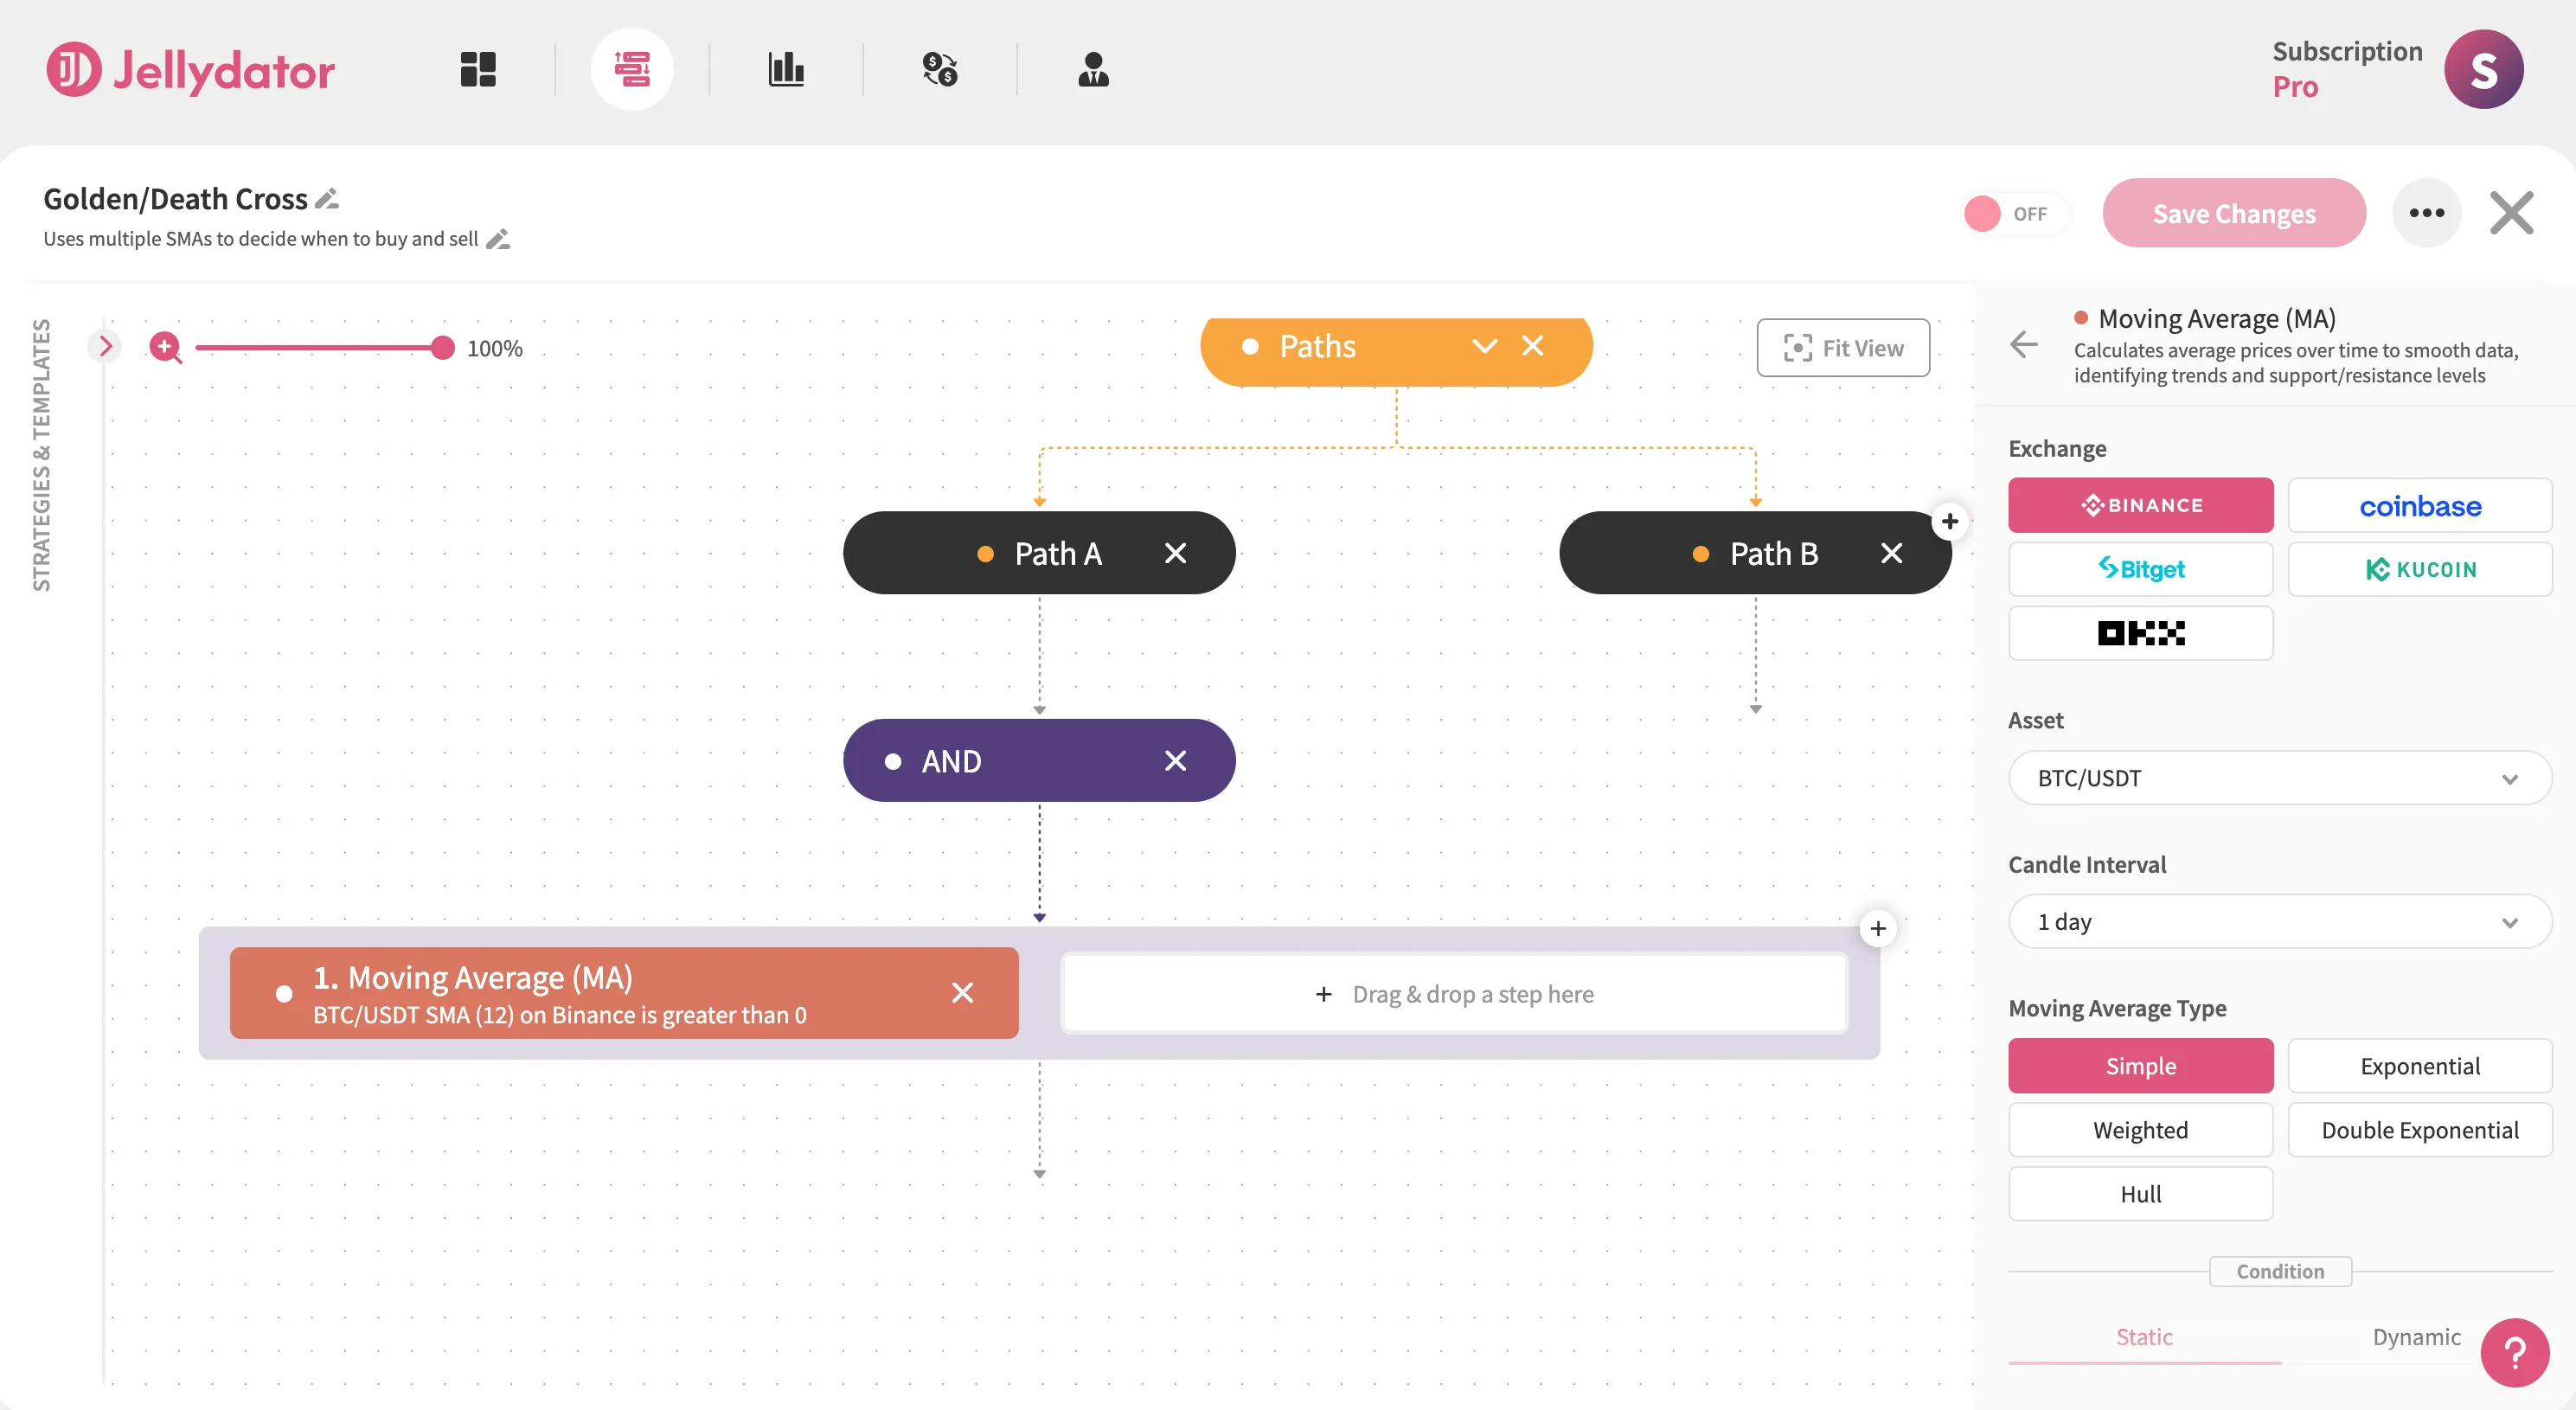
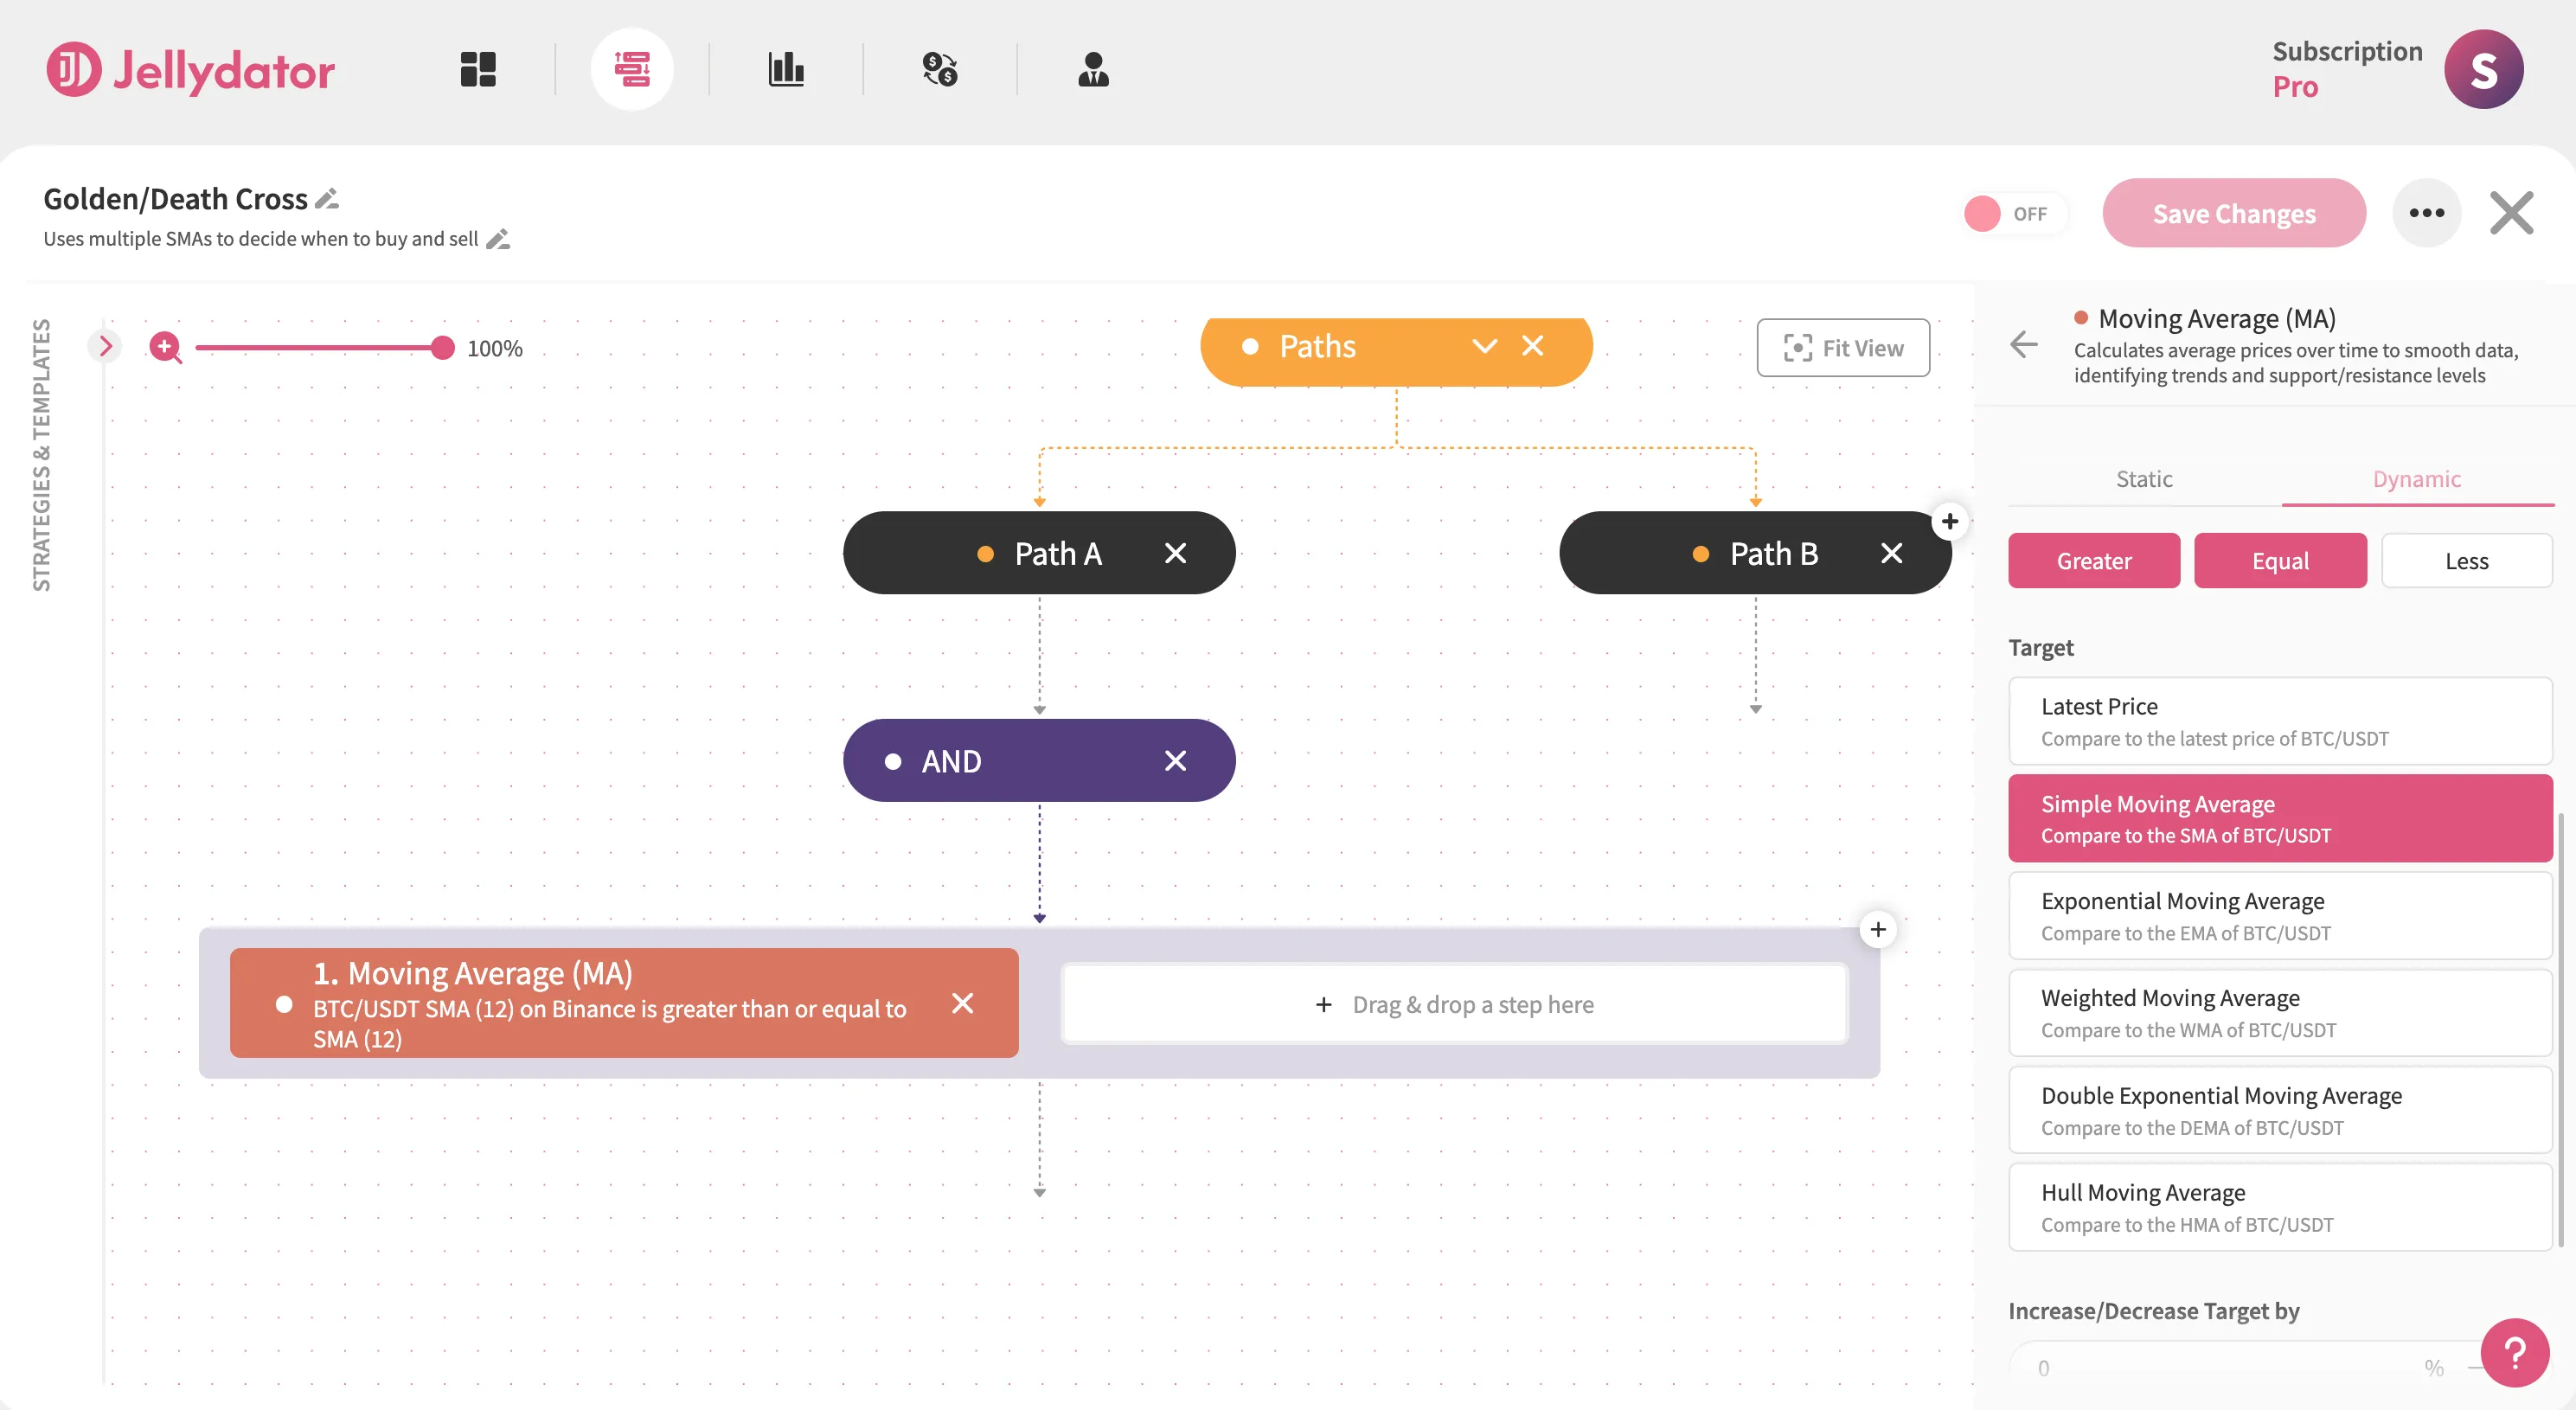
Inside the AND step in Path A, add the first Moving Average step and select it to open the configuration panel. Ensure the indicator calculates and uses the Simple Moving Average (SMA) for your target asset (we’ll use BTC/USDT in this guide). Then, select the 1-day candle interval.
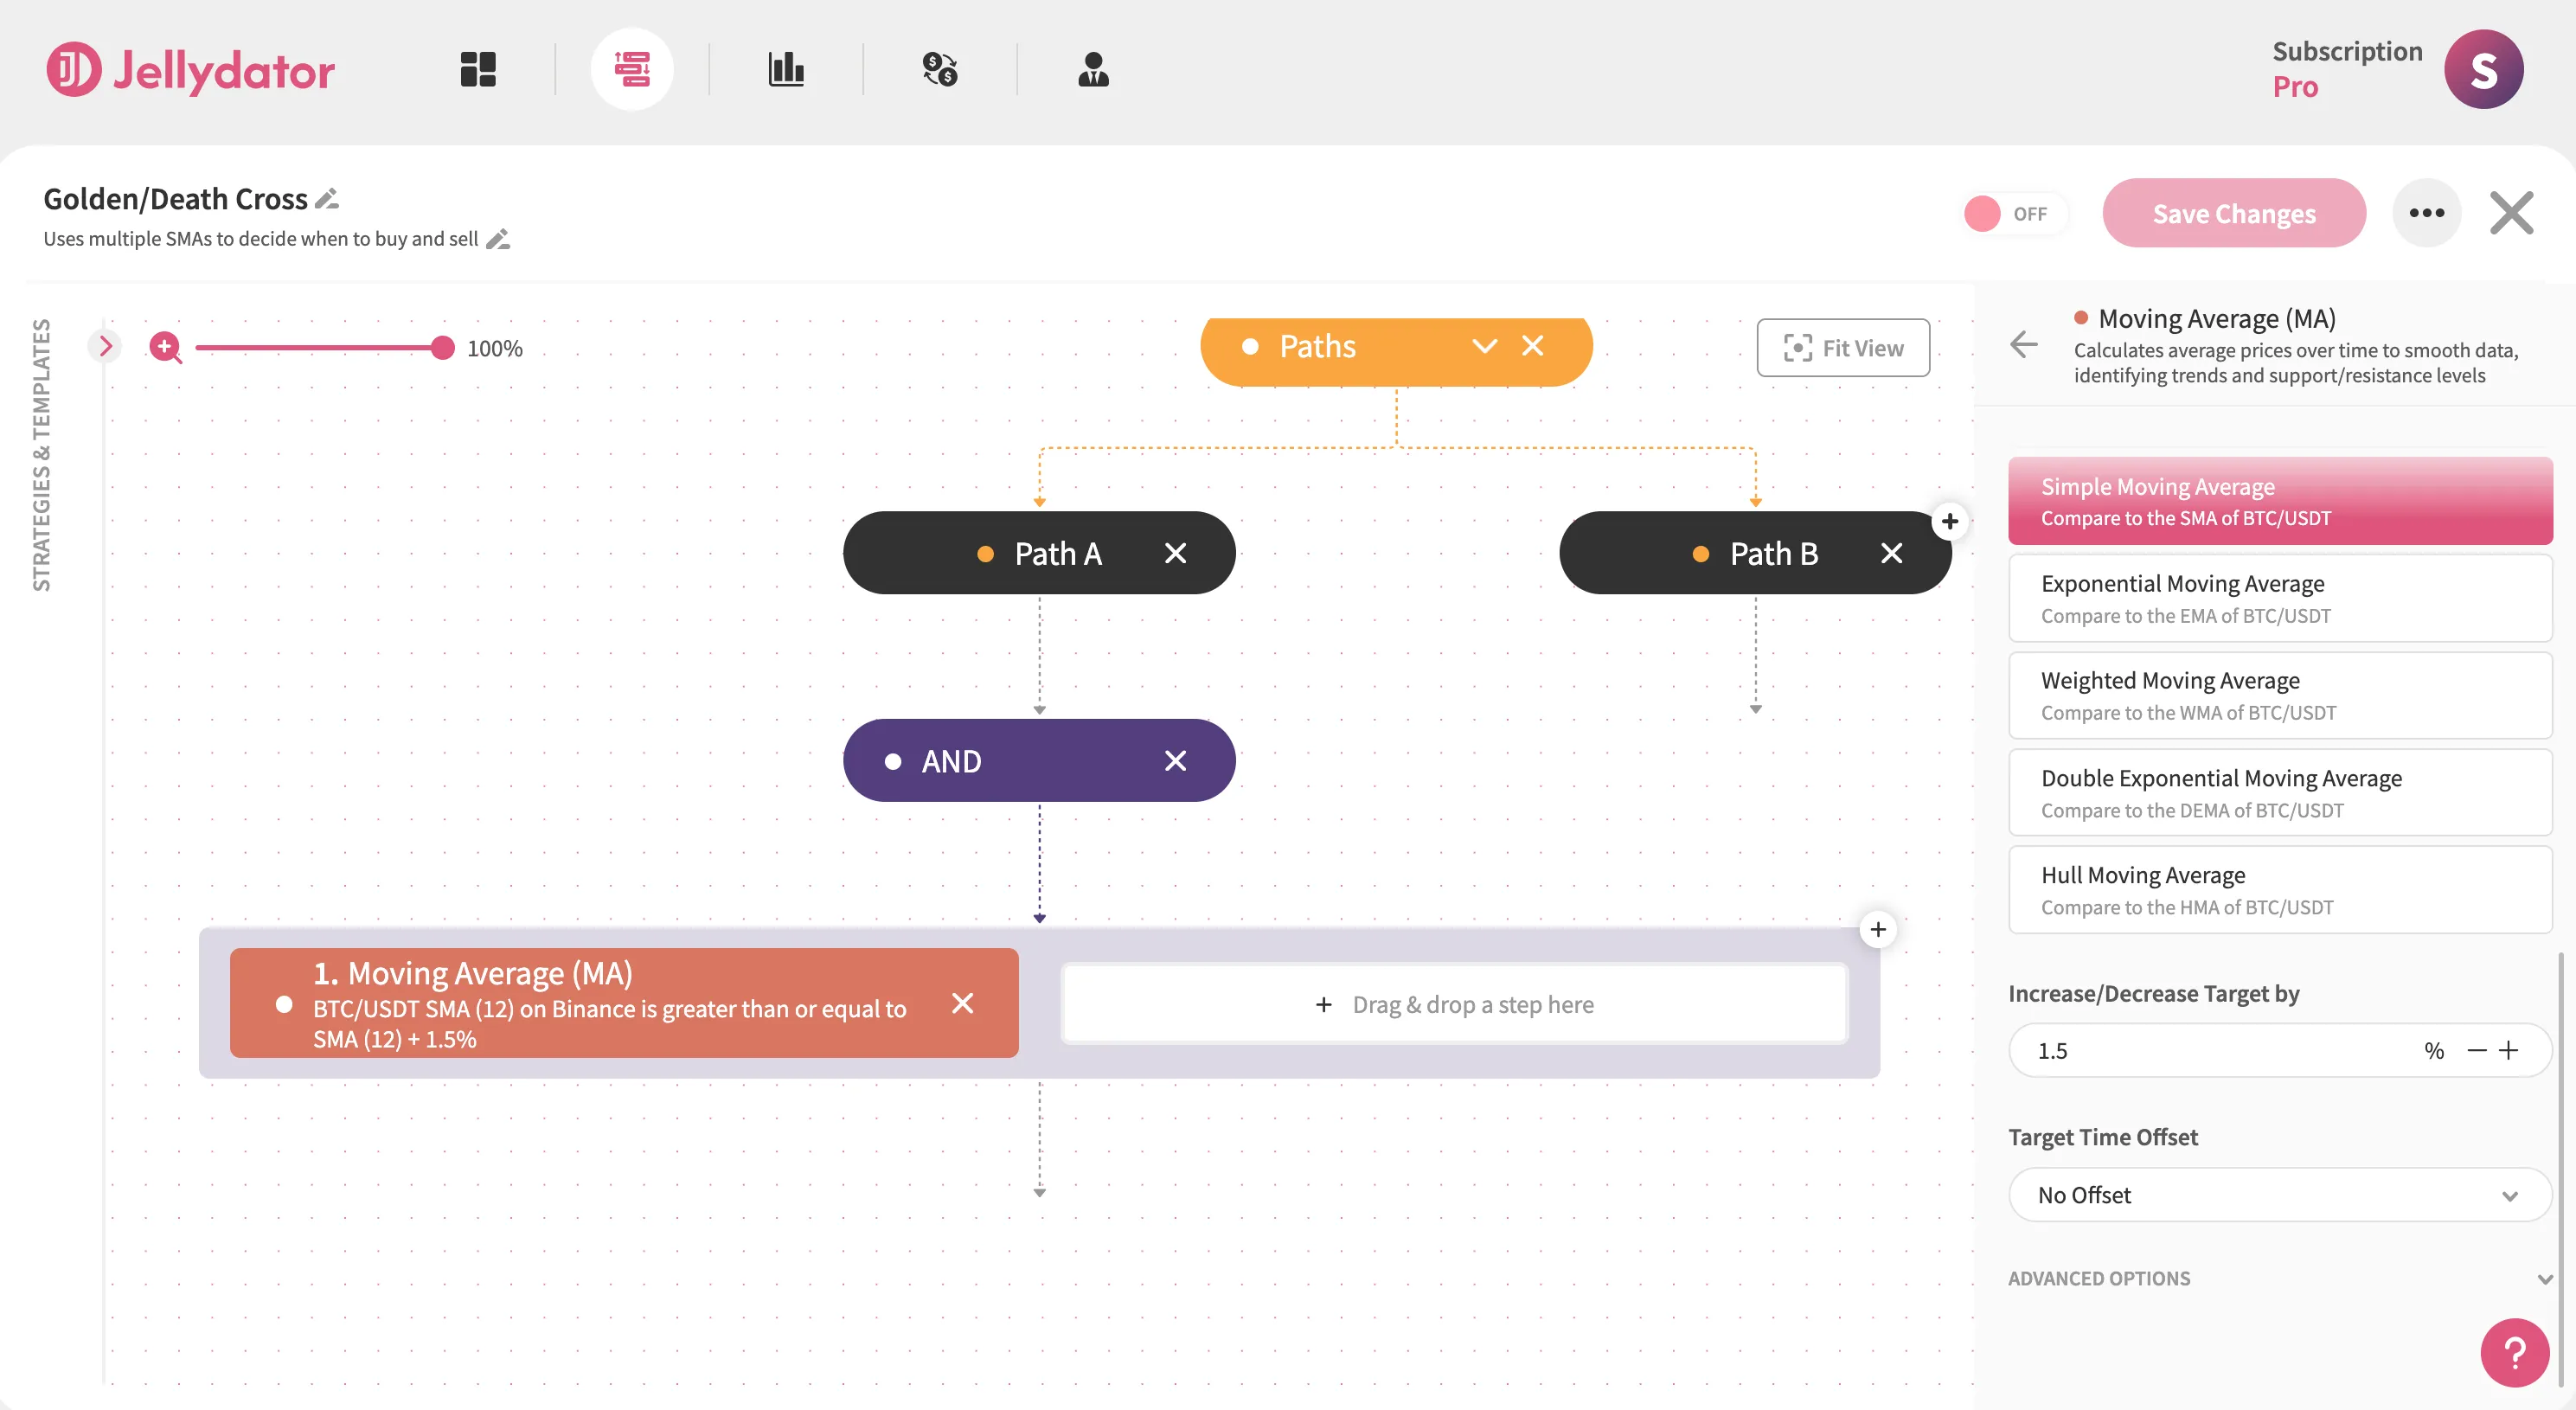
Scroll to the “Condition” section, choose the “Dynamic” option, then set “Simple Moving Average” as the condition target. Select Greater and Equal as the operator to establish the “Short SMA ≥ Long SMA” condition.
In the “Increase/Decrease Target by” input field, enter “1.5”. This means that we want the short SMA to be greater than the long SMA increased by 1.5%. This helps reduce the number of false signals generated when the short SMA touches and then immediately drops below the long SMA again.
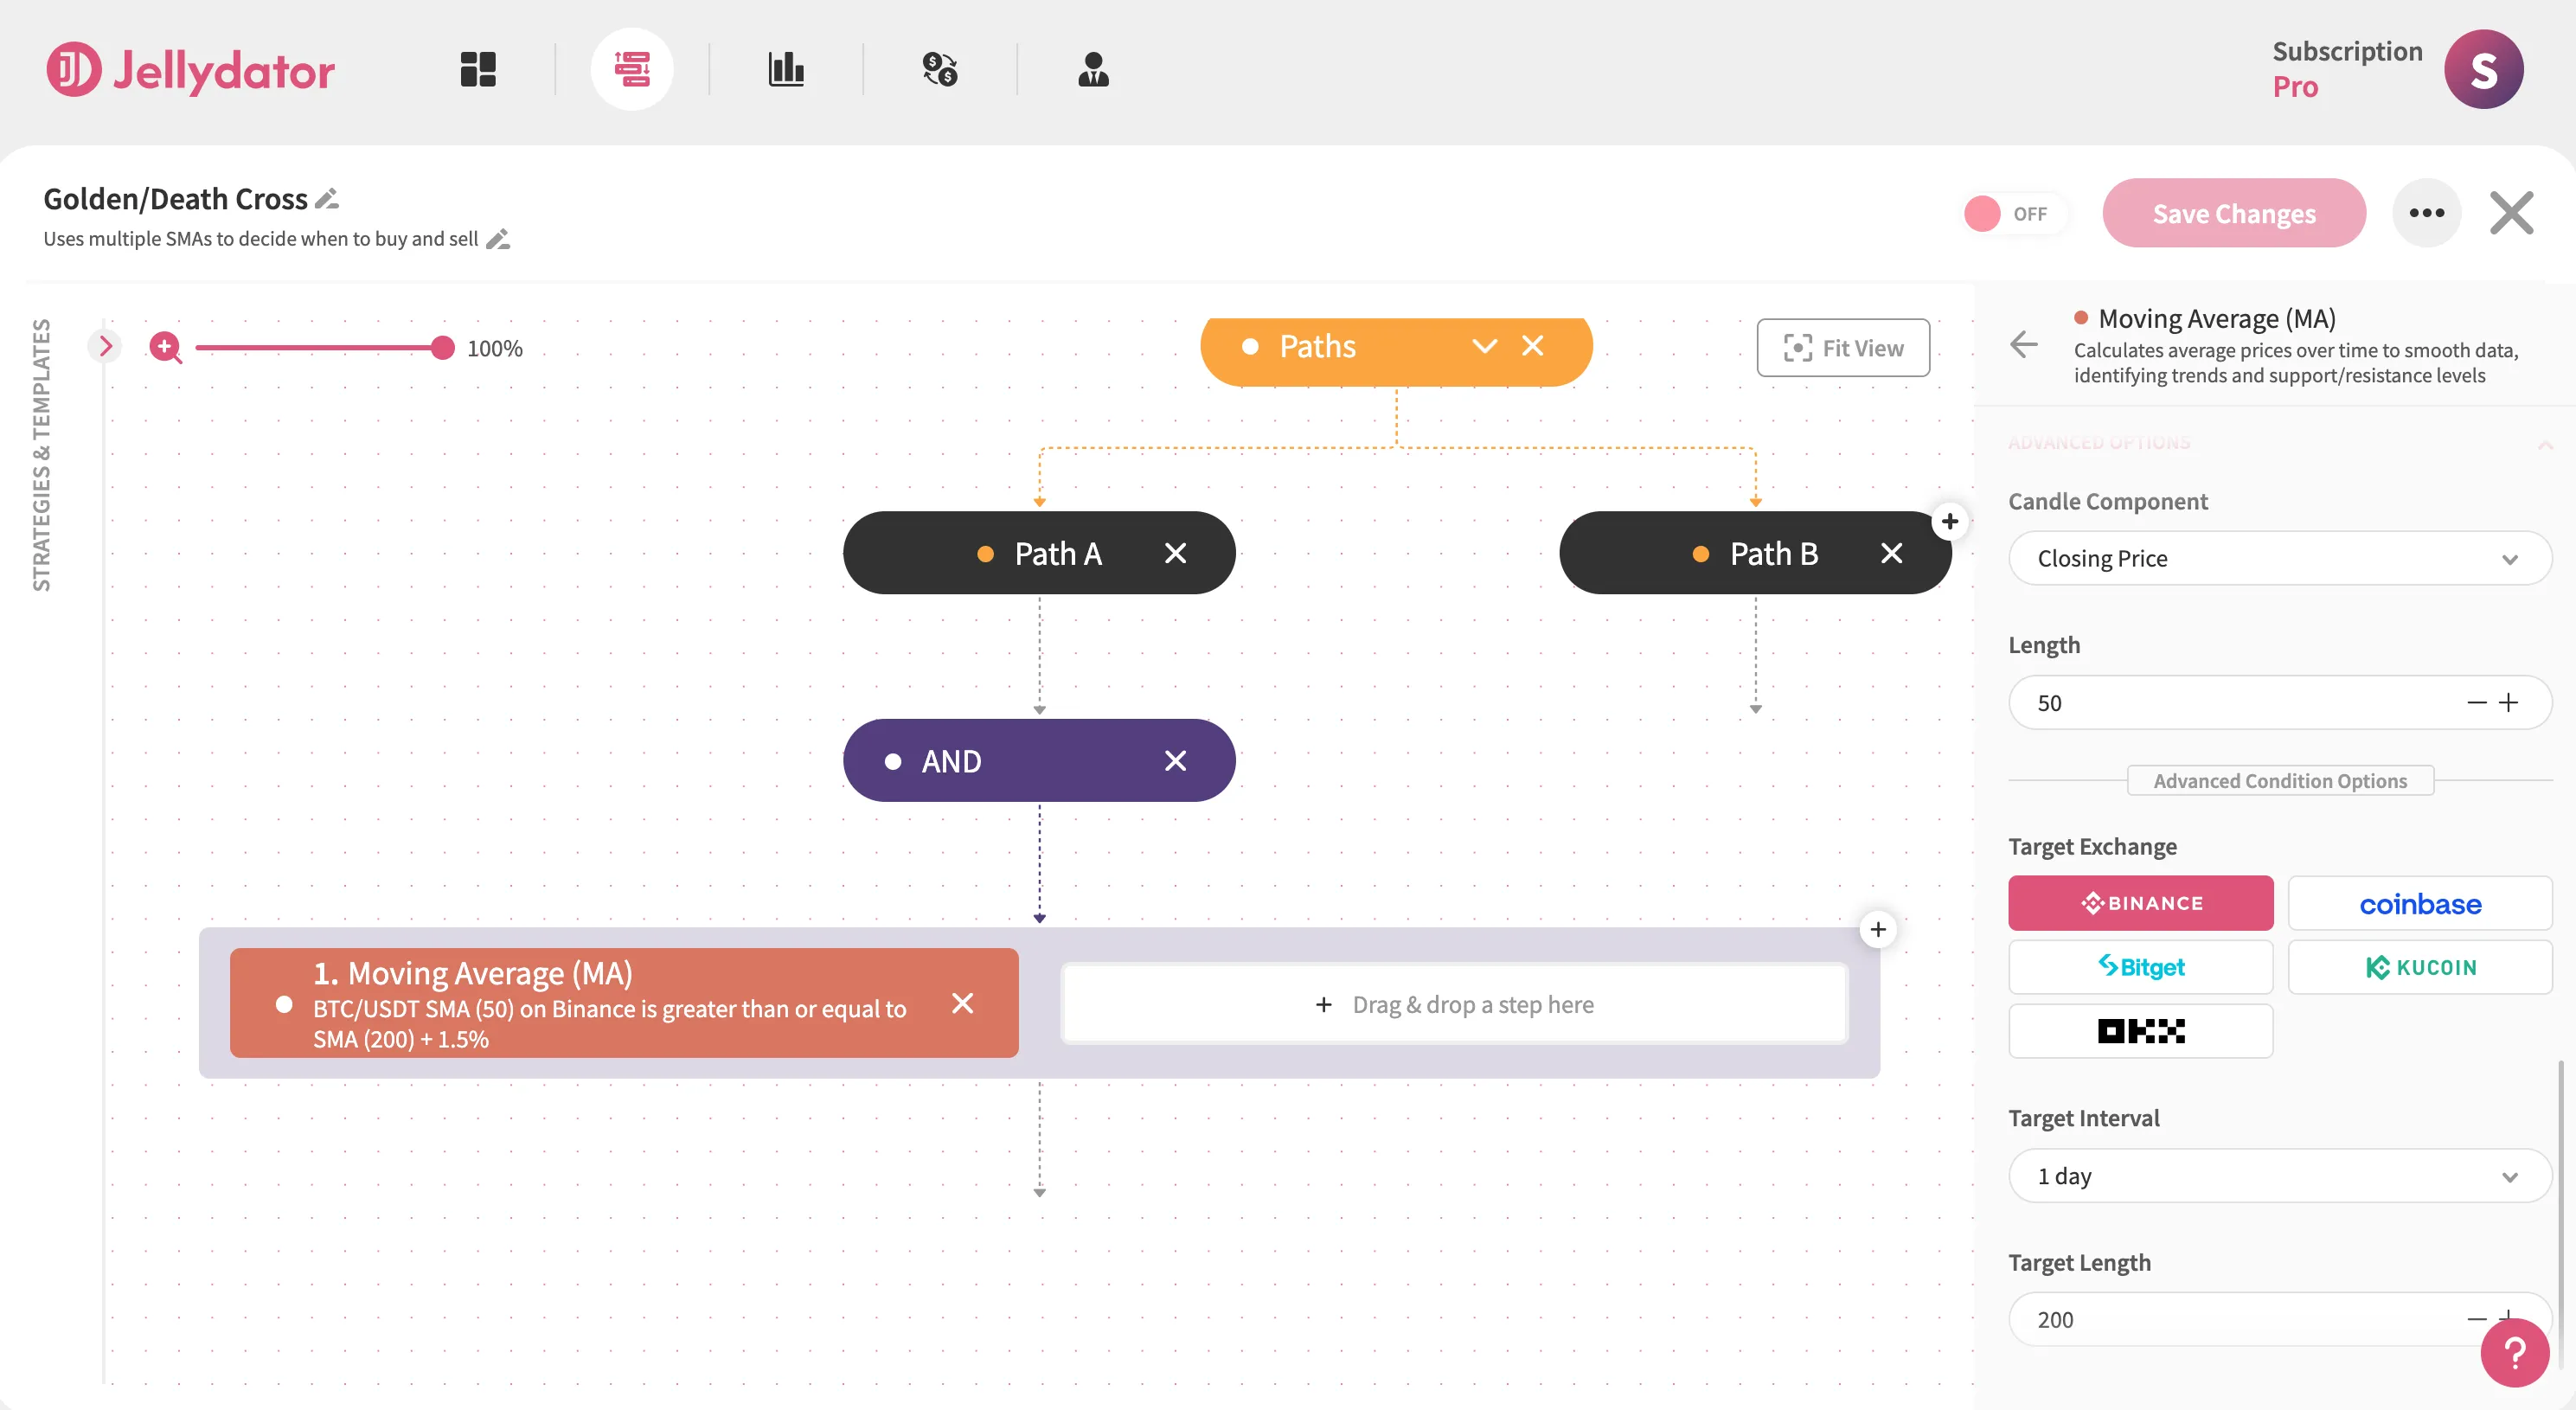
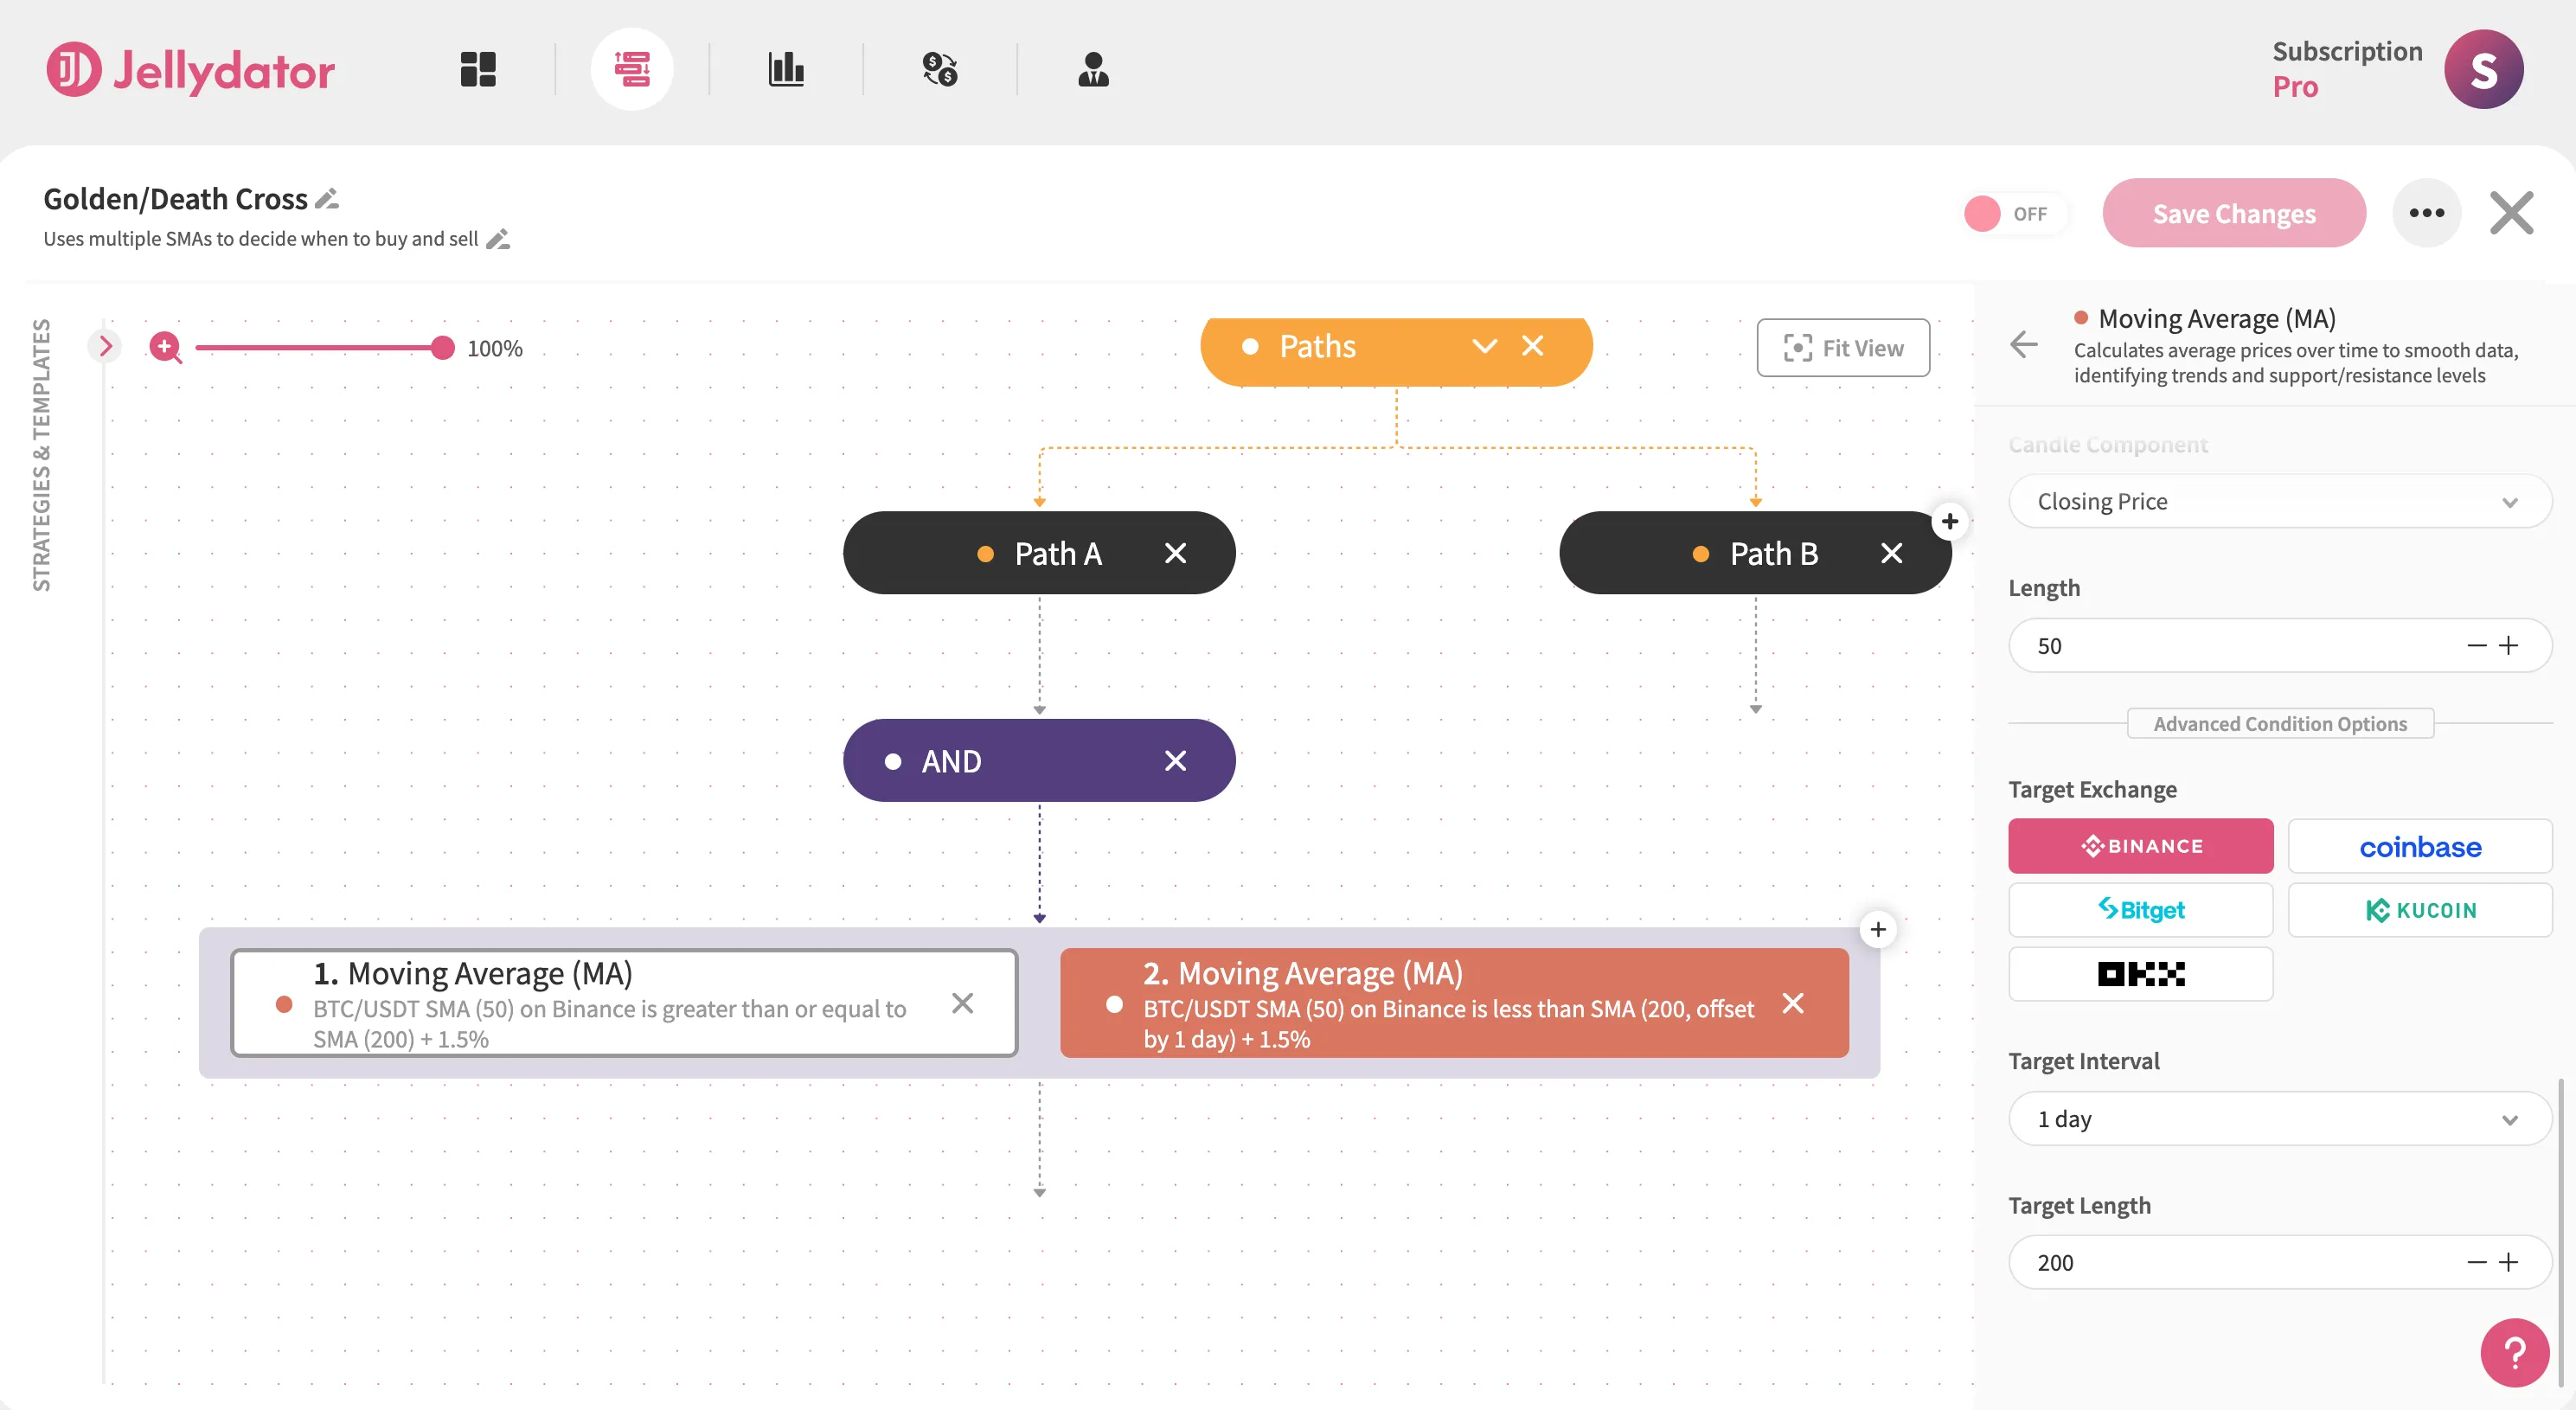
Next, click on the “Advanced Options” button. Once the “Advanced Options” section appears, set the “Length” to 50 (this is the length of the short SMA) and the condition “Target Length” to 200 (the length of the long SMA).
Now, add the second Moving Average step inside the AND step in Path A, and then select it to open the configuration panel. The purpose of this Moving Average is to ensure that the cross didn’t occur in the previous period and that it happened only in the current one. To do this, use the same BTC/USDT pair, a 1-day interval, and the Simple moving average type.
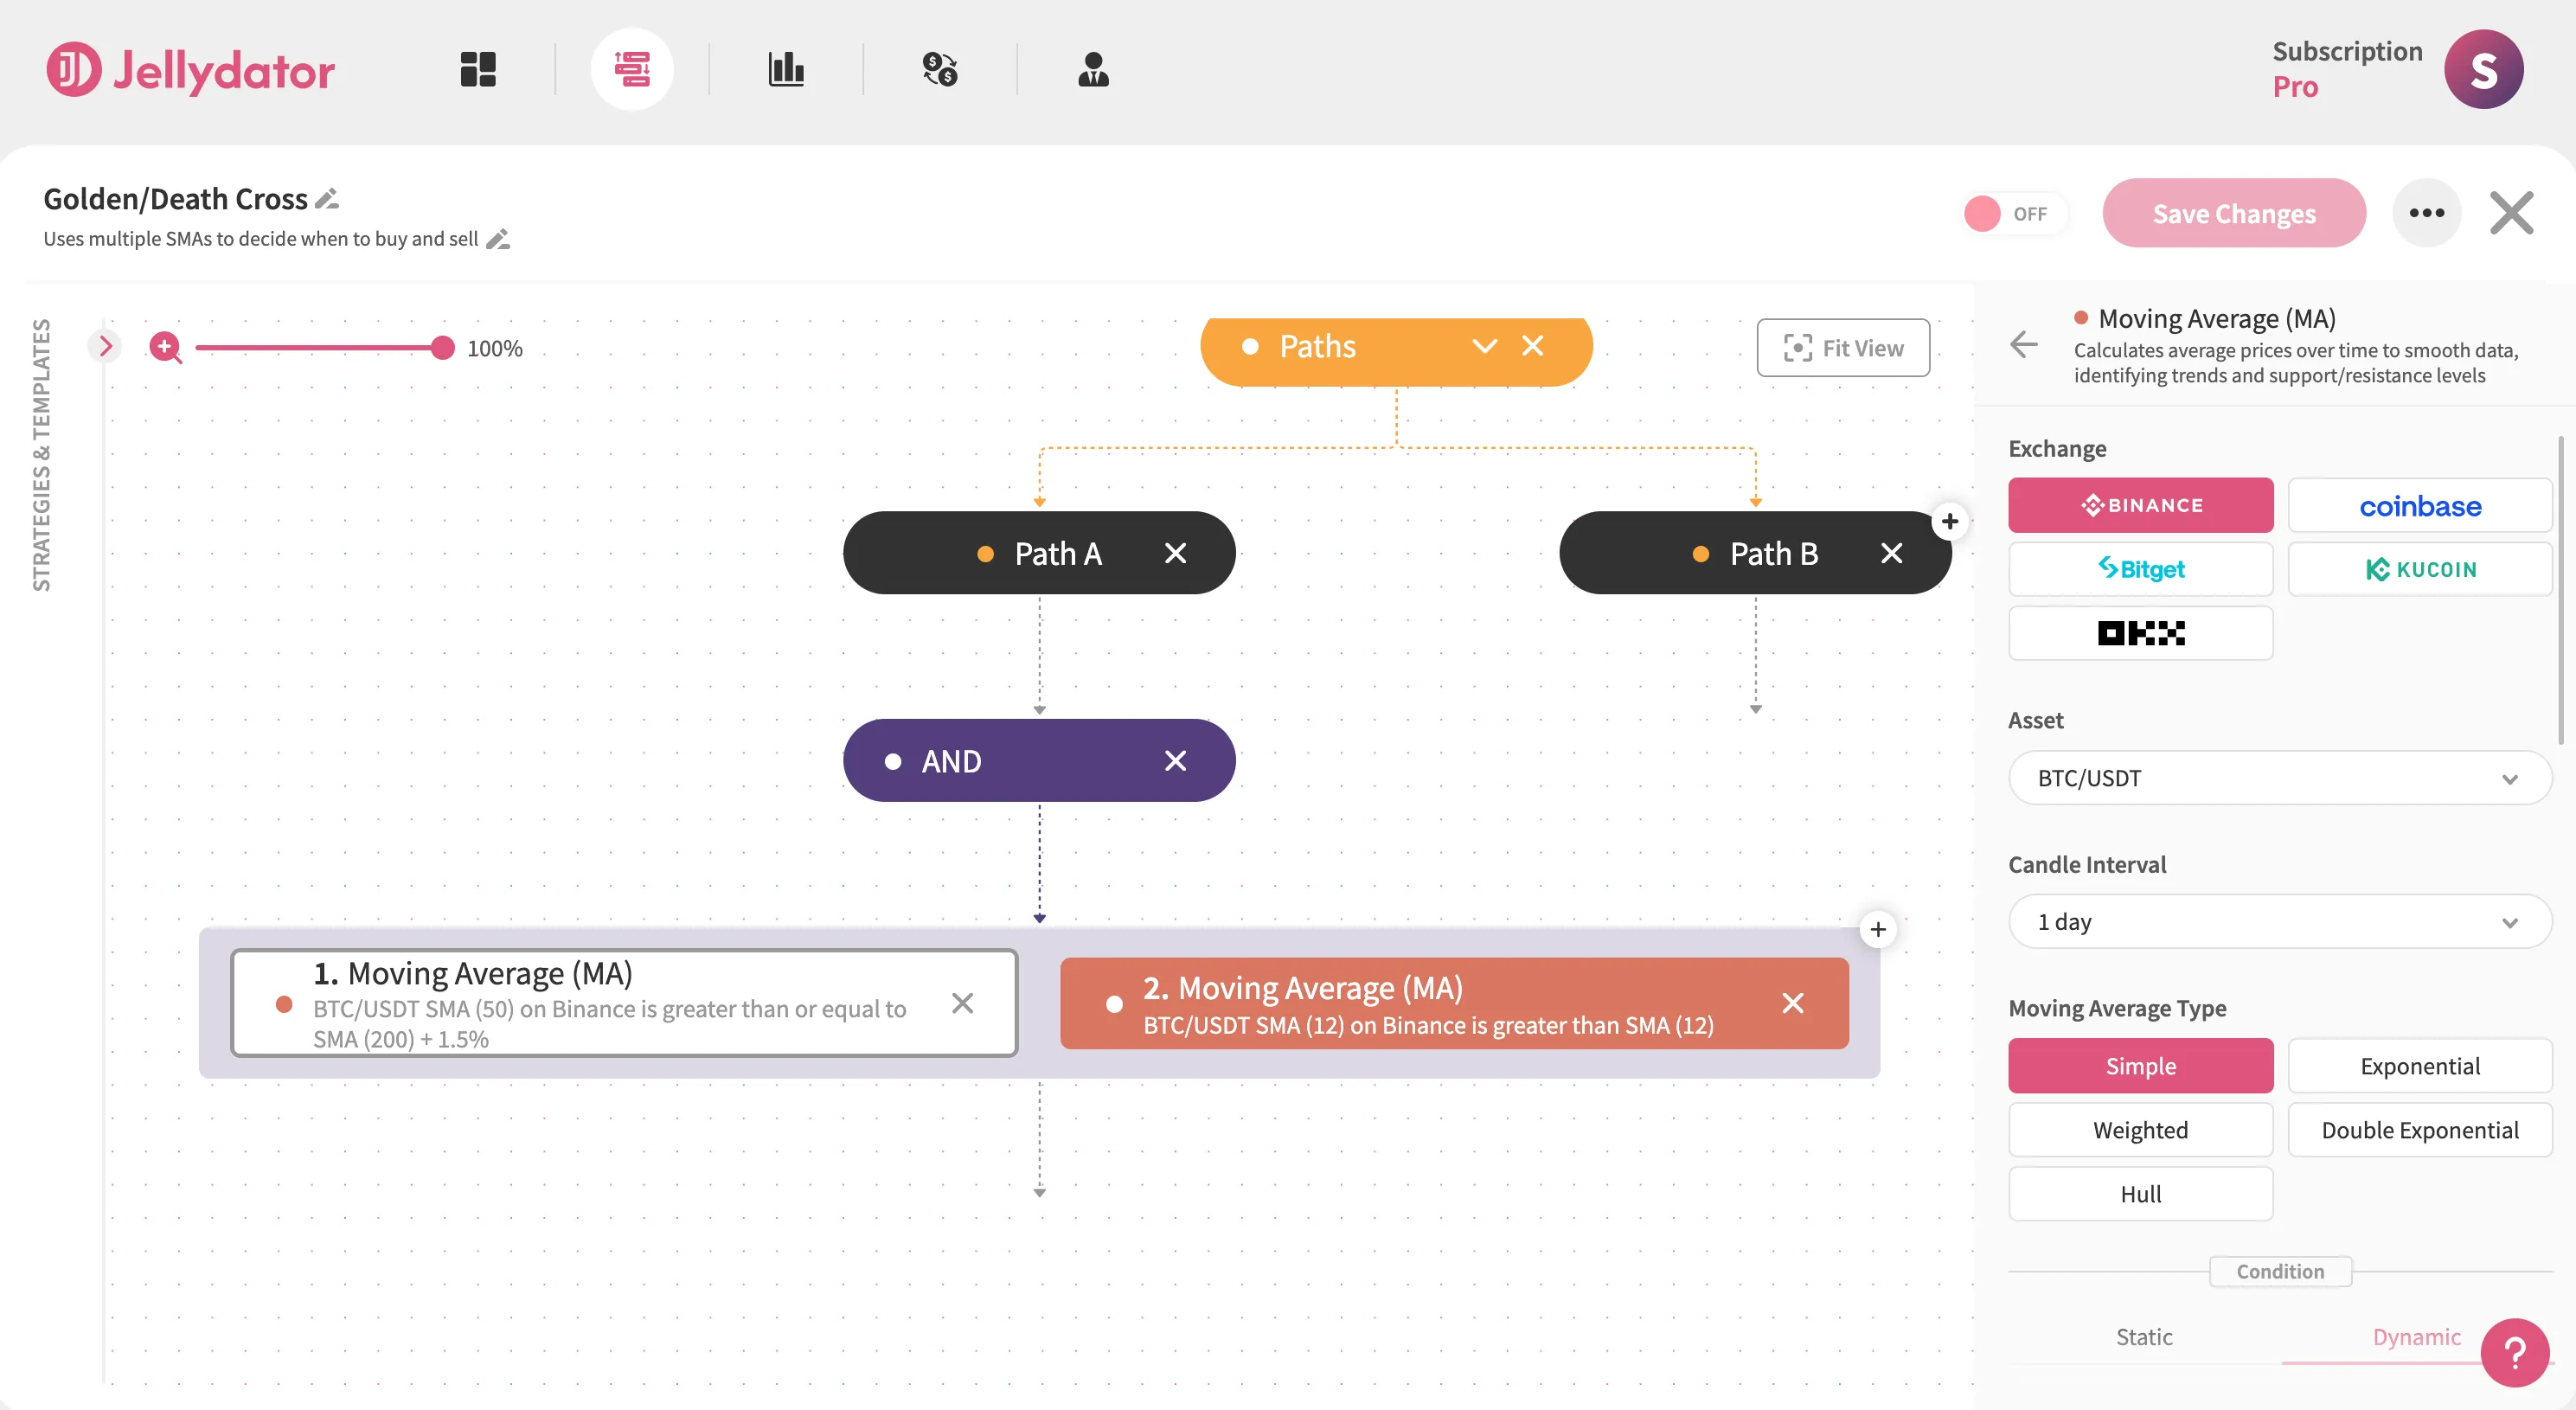
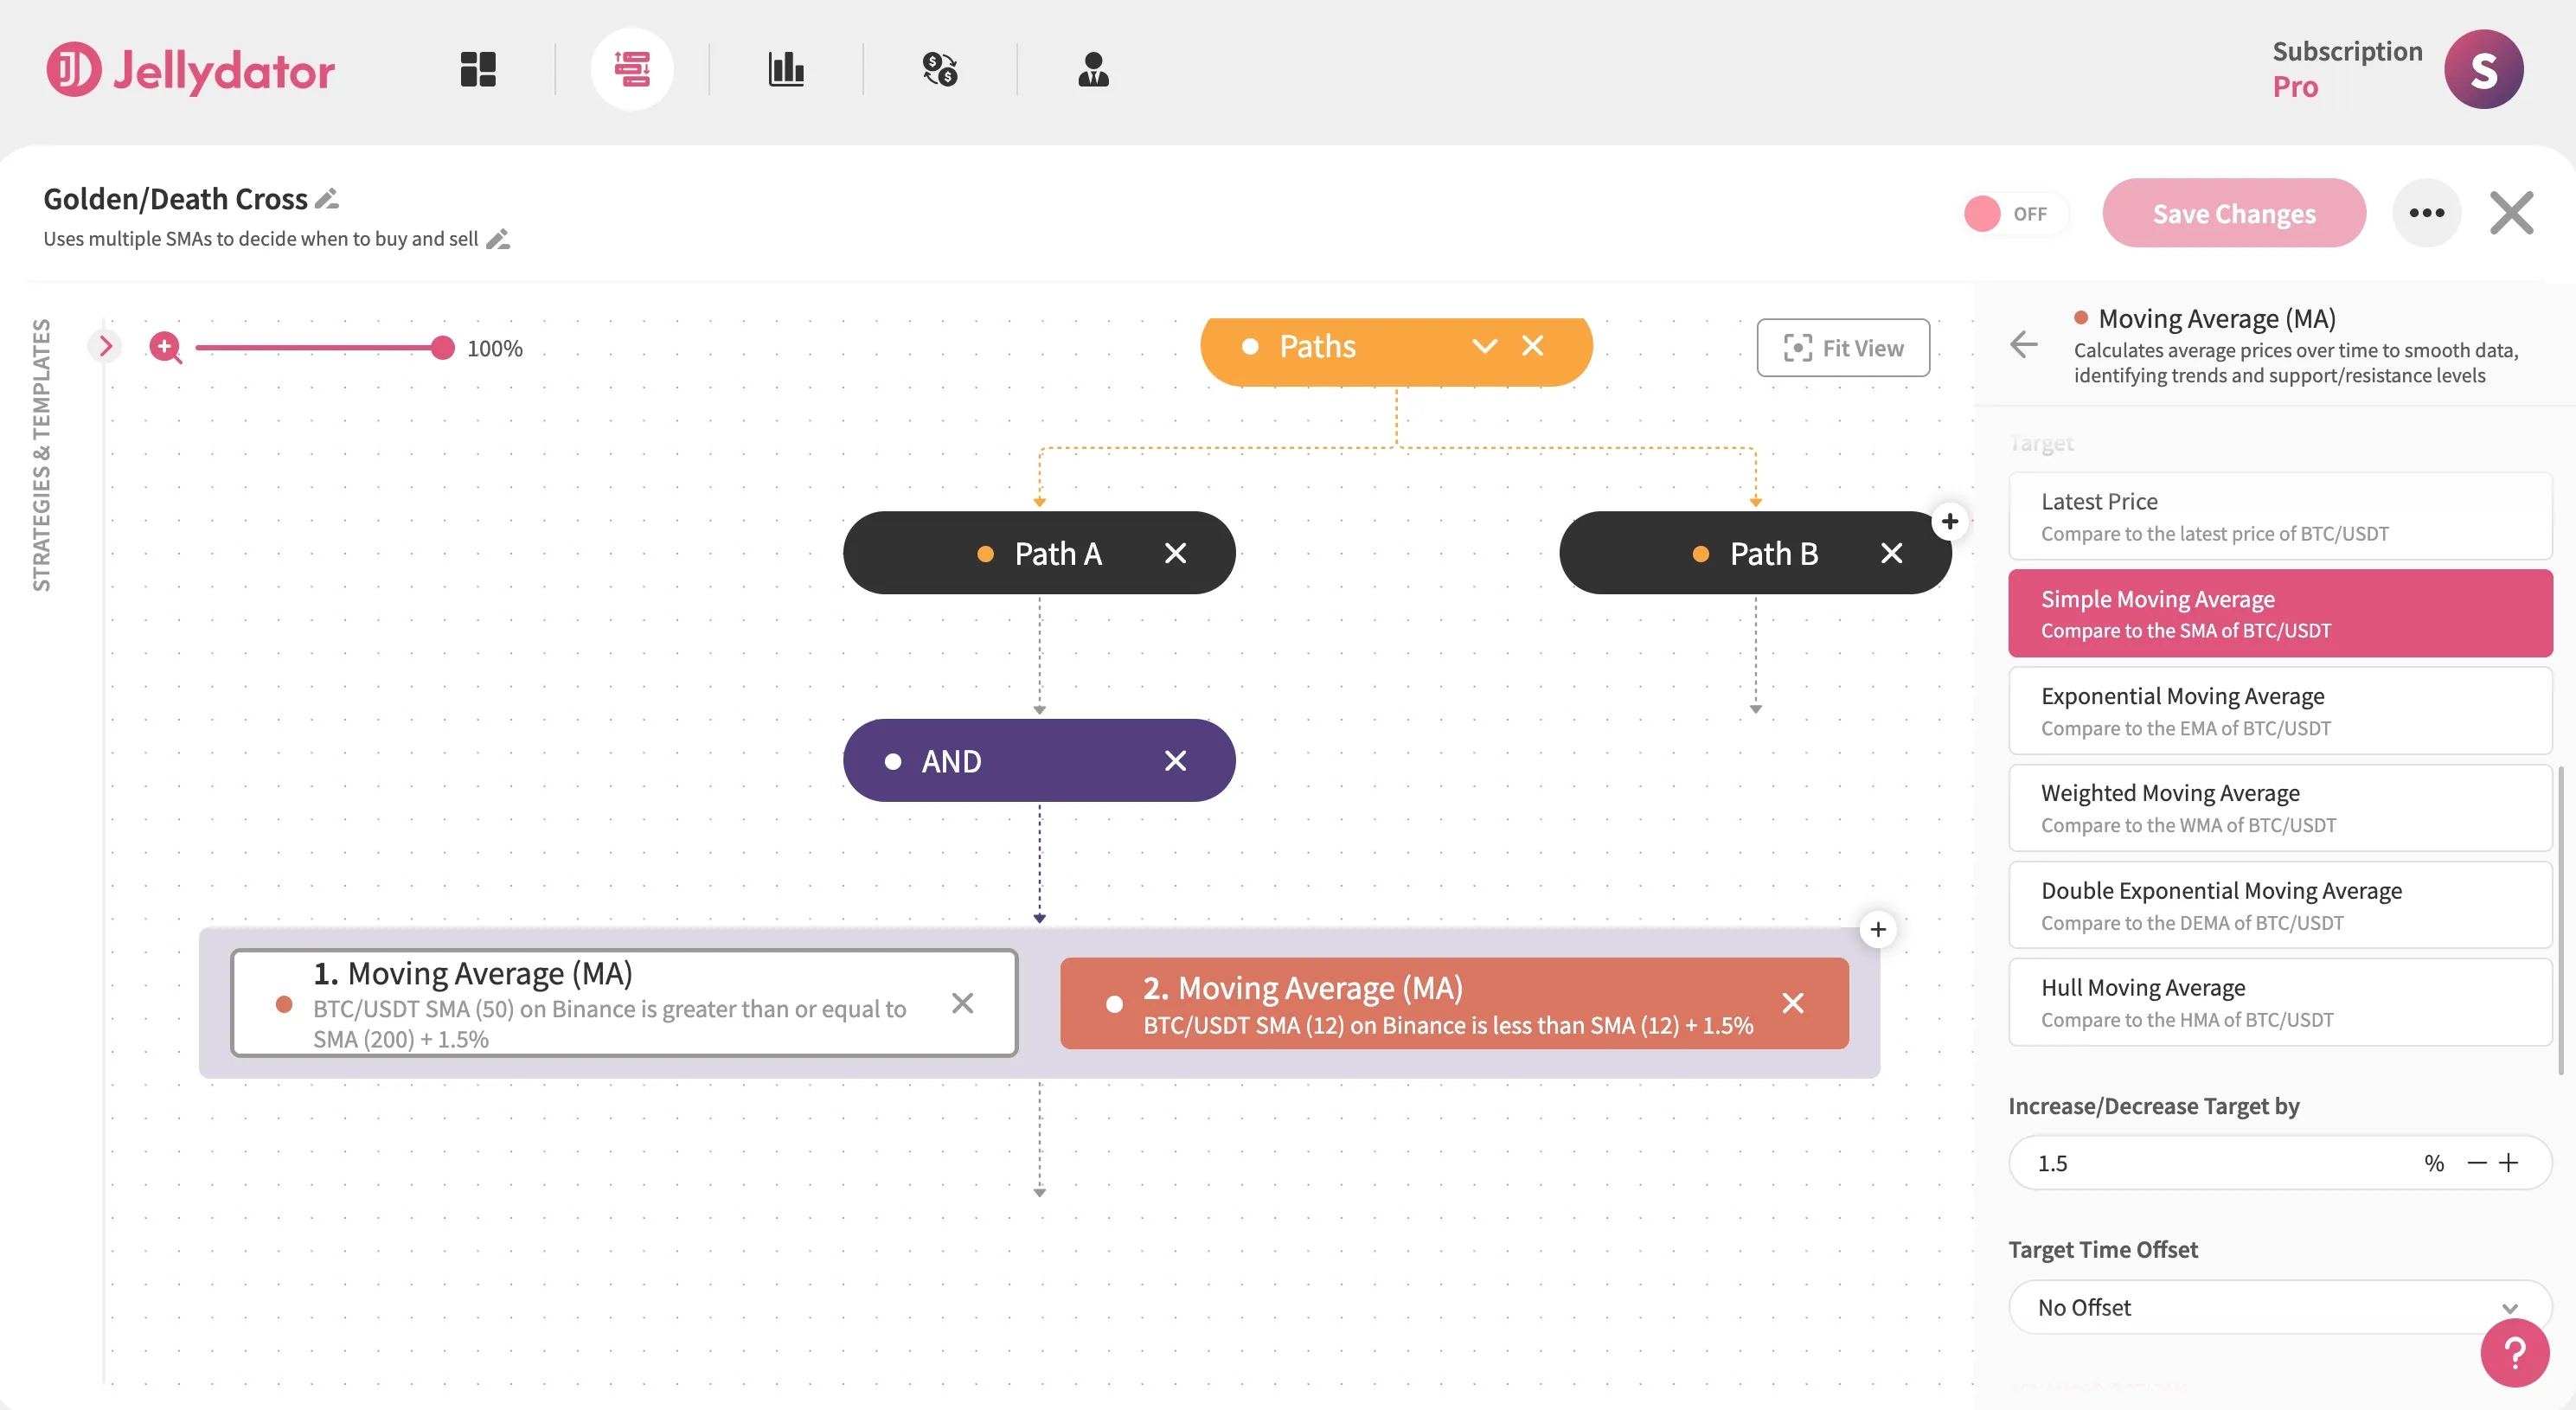
Scroll to the “Condition” section, choose the “Dynamic” option, then set “Simple Moving Average” as the condition target. Select Less as the operator to establish the “Short SMA < Long SMA” condition.
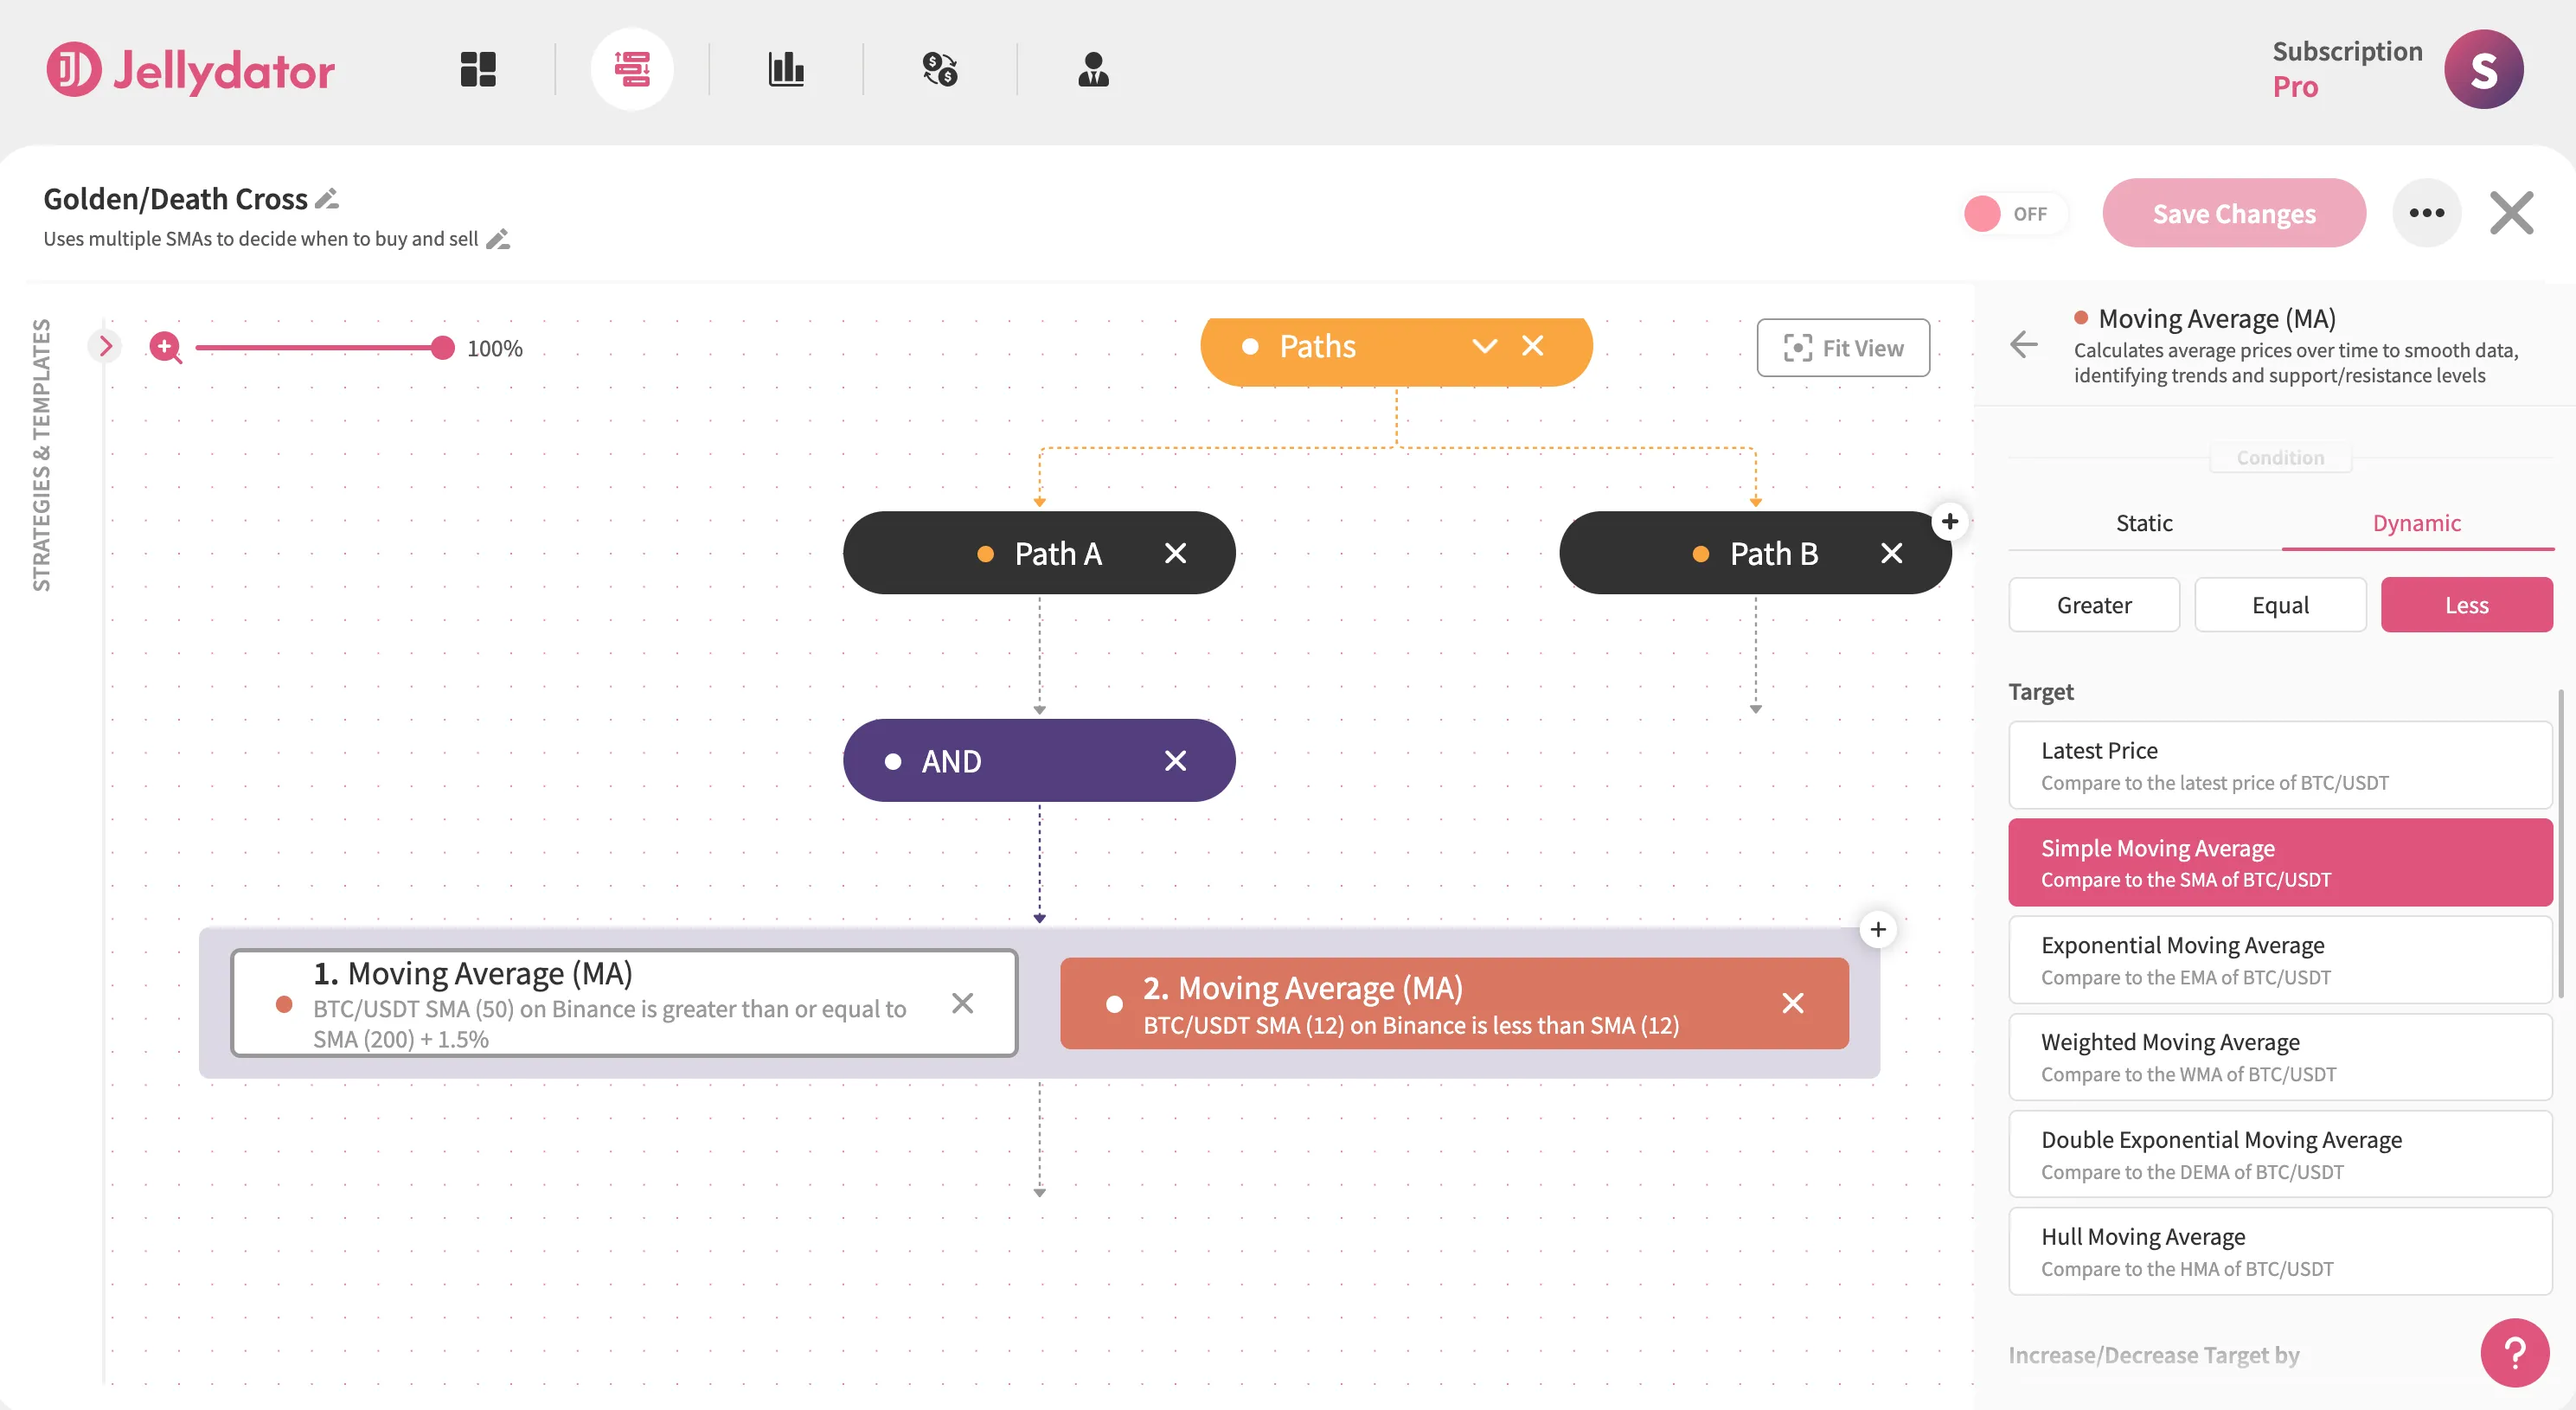
In the “Increase/Decrease Target by” input field, enter “1.5”.
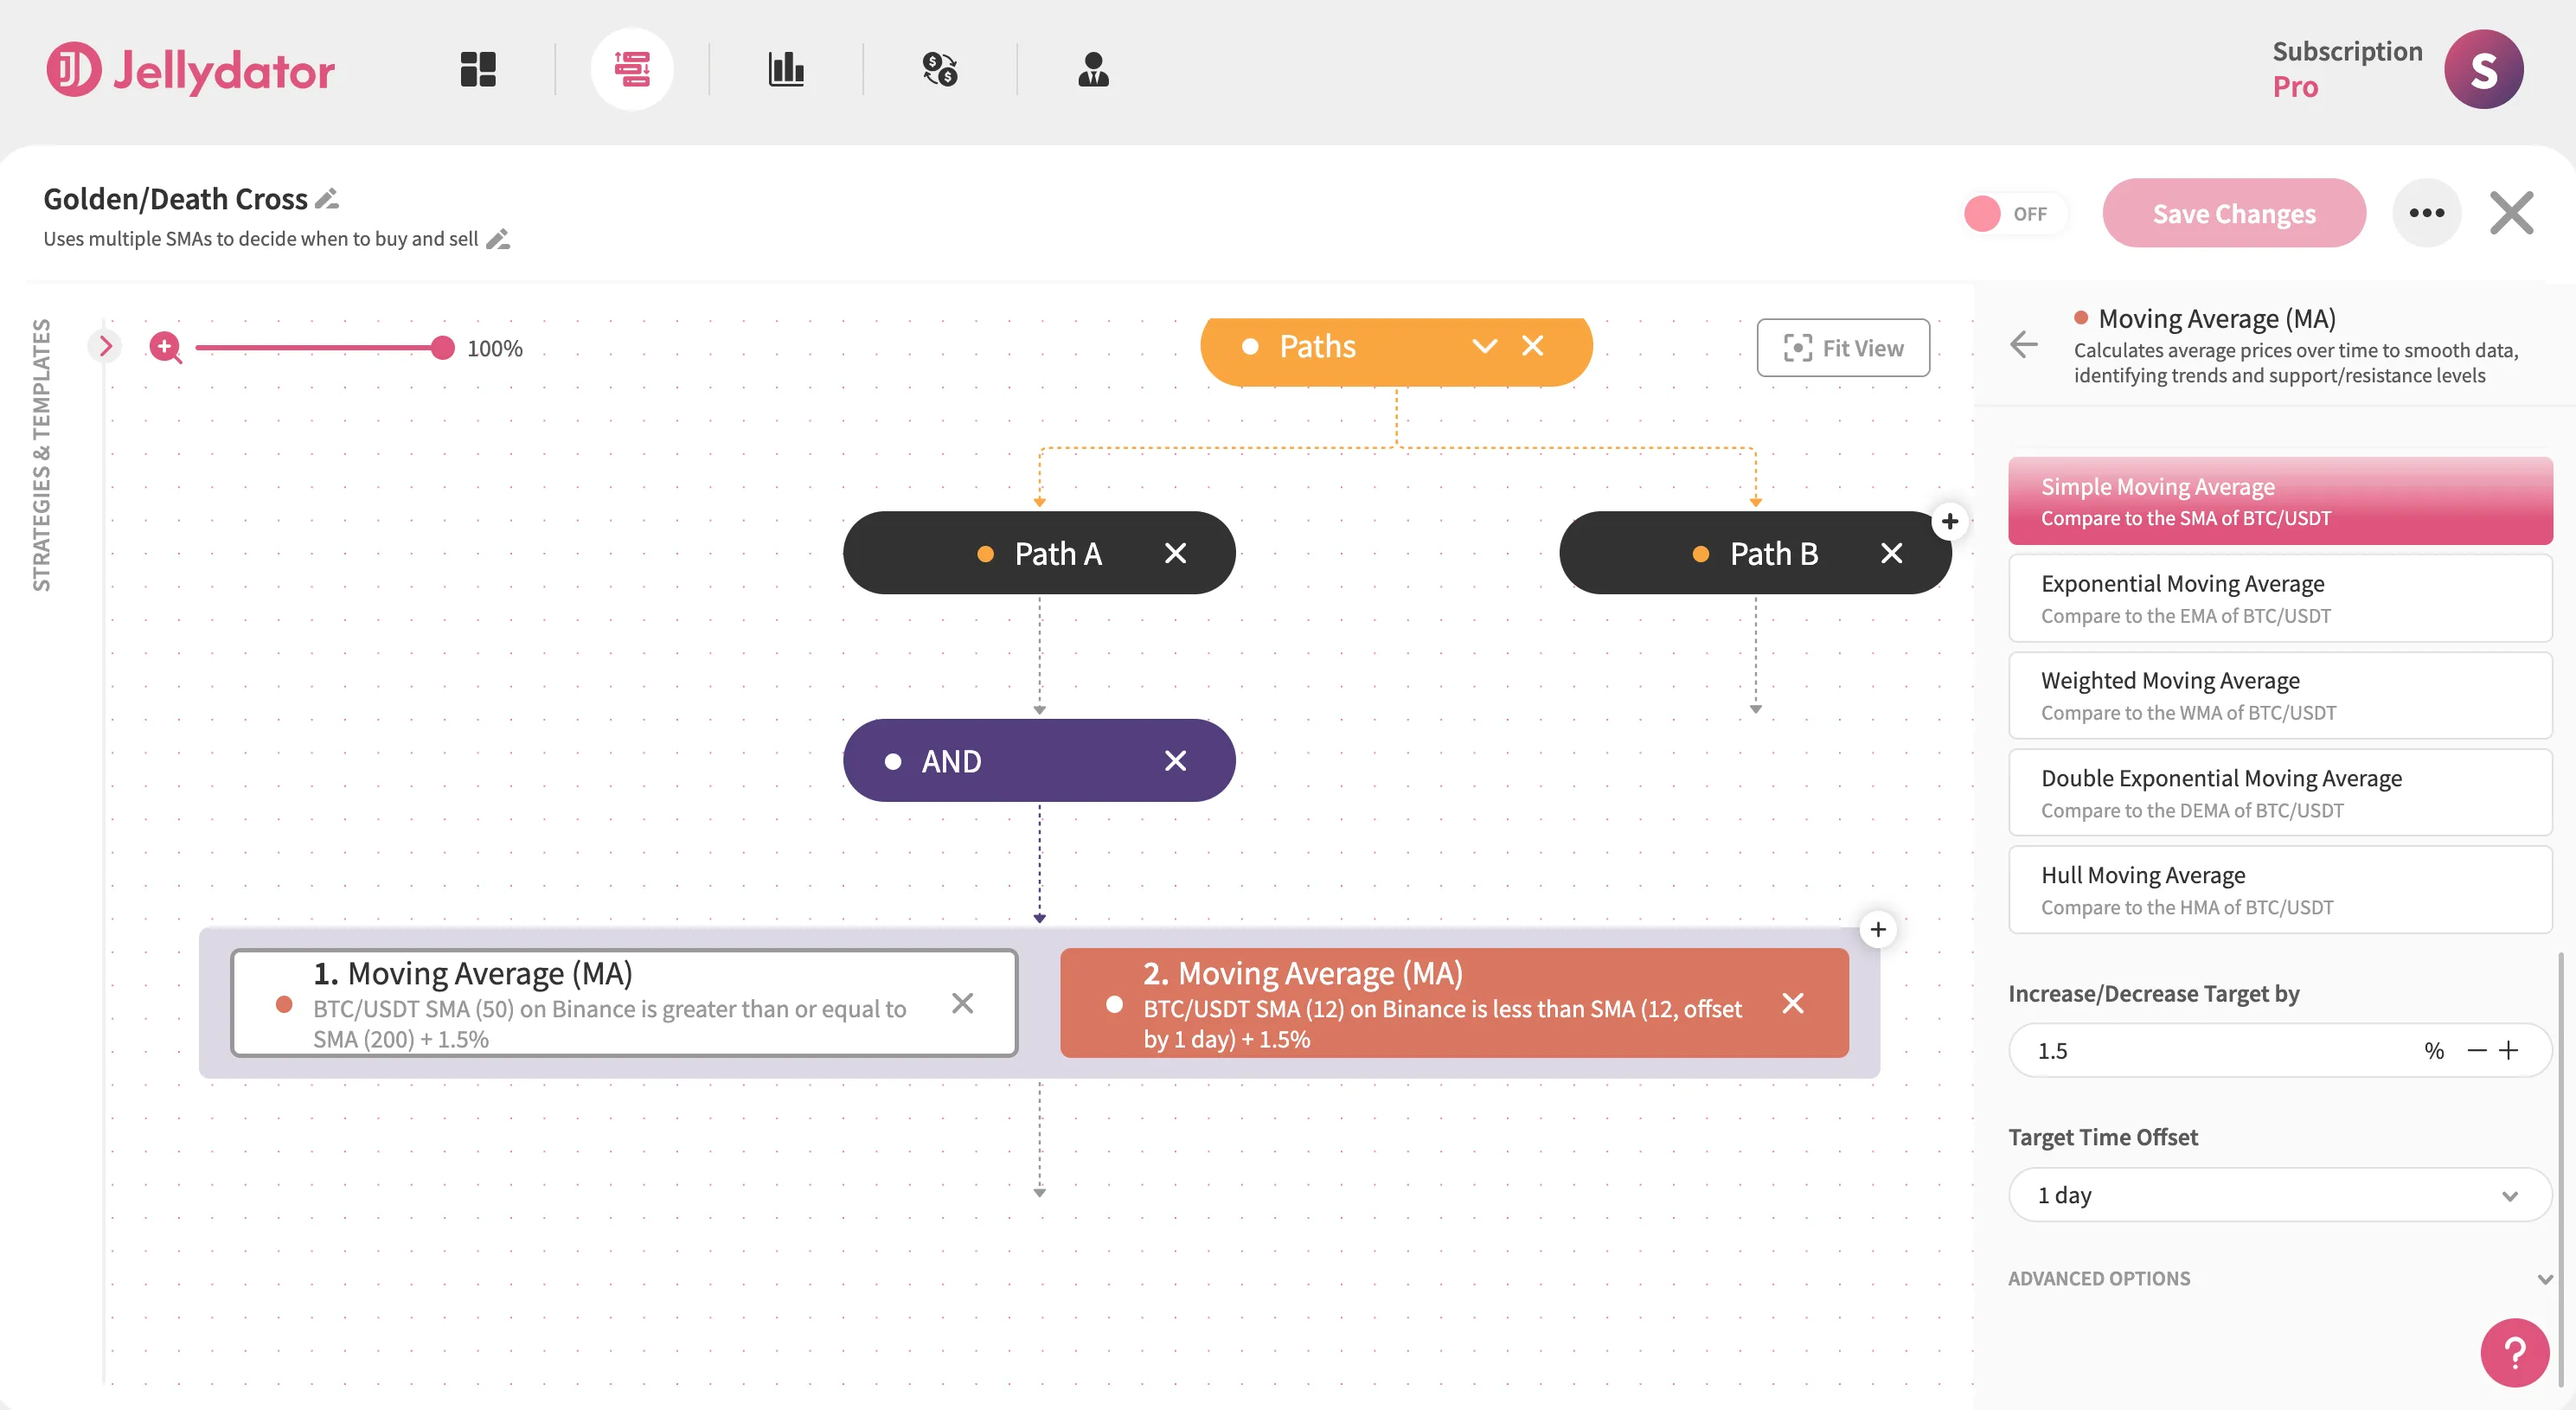
Since the purpose of this step is to check the values of the previous period, set the “Target Time Offset” to “1-day”.
Finally, just like with the first Moving Average, click on the “Advanced Options” button and set the “Length” to 50 (the length of the short SMA) and the condition “Target Length” condition to 200 (the length of the long SMA).
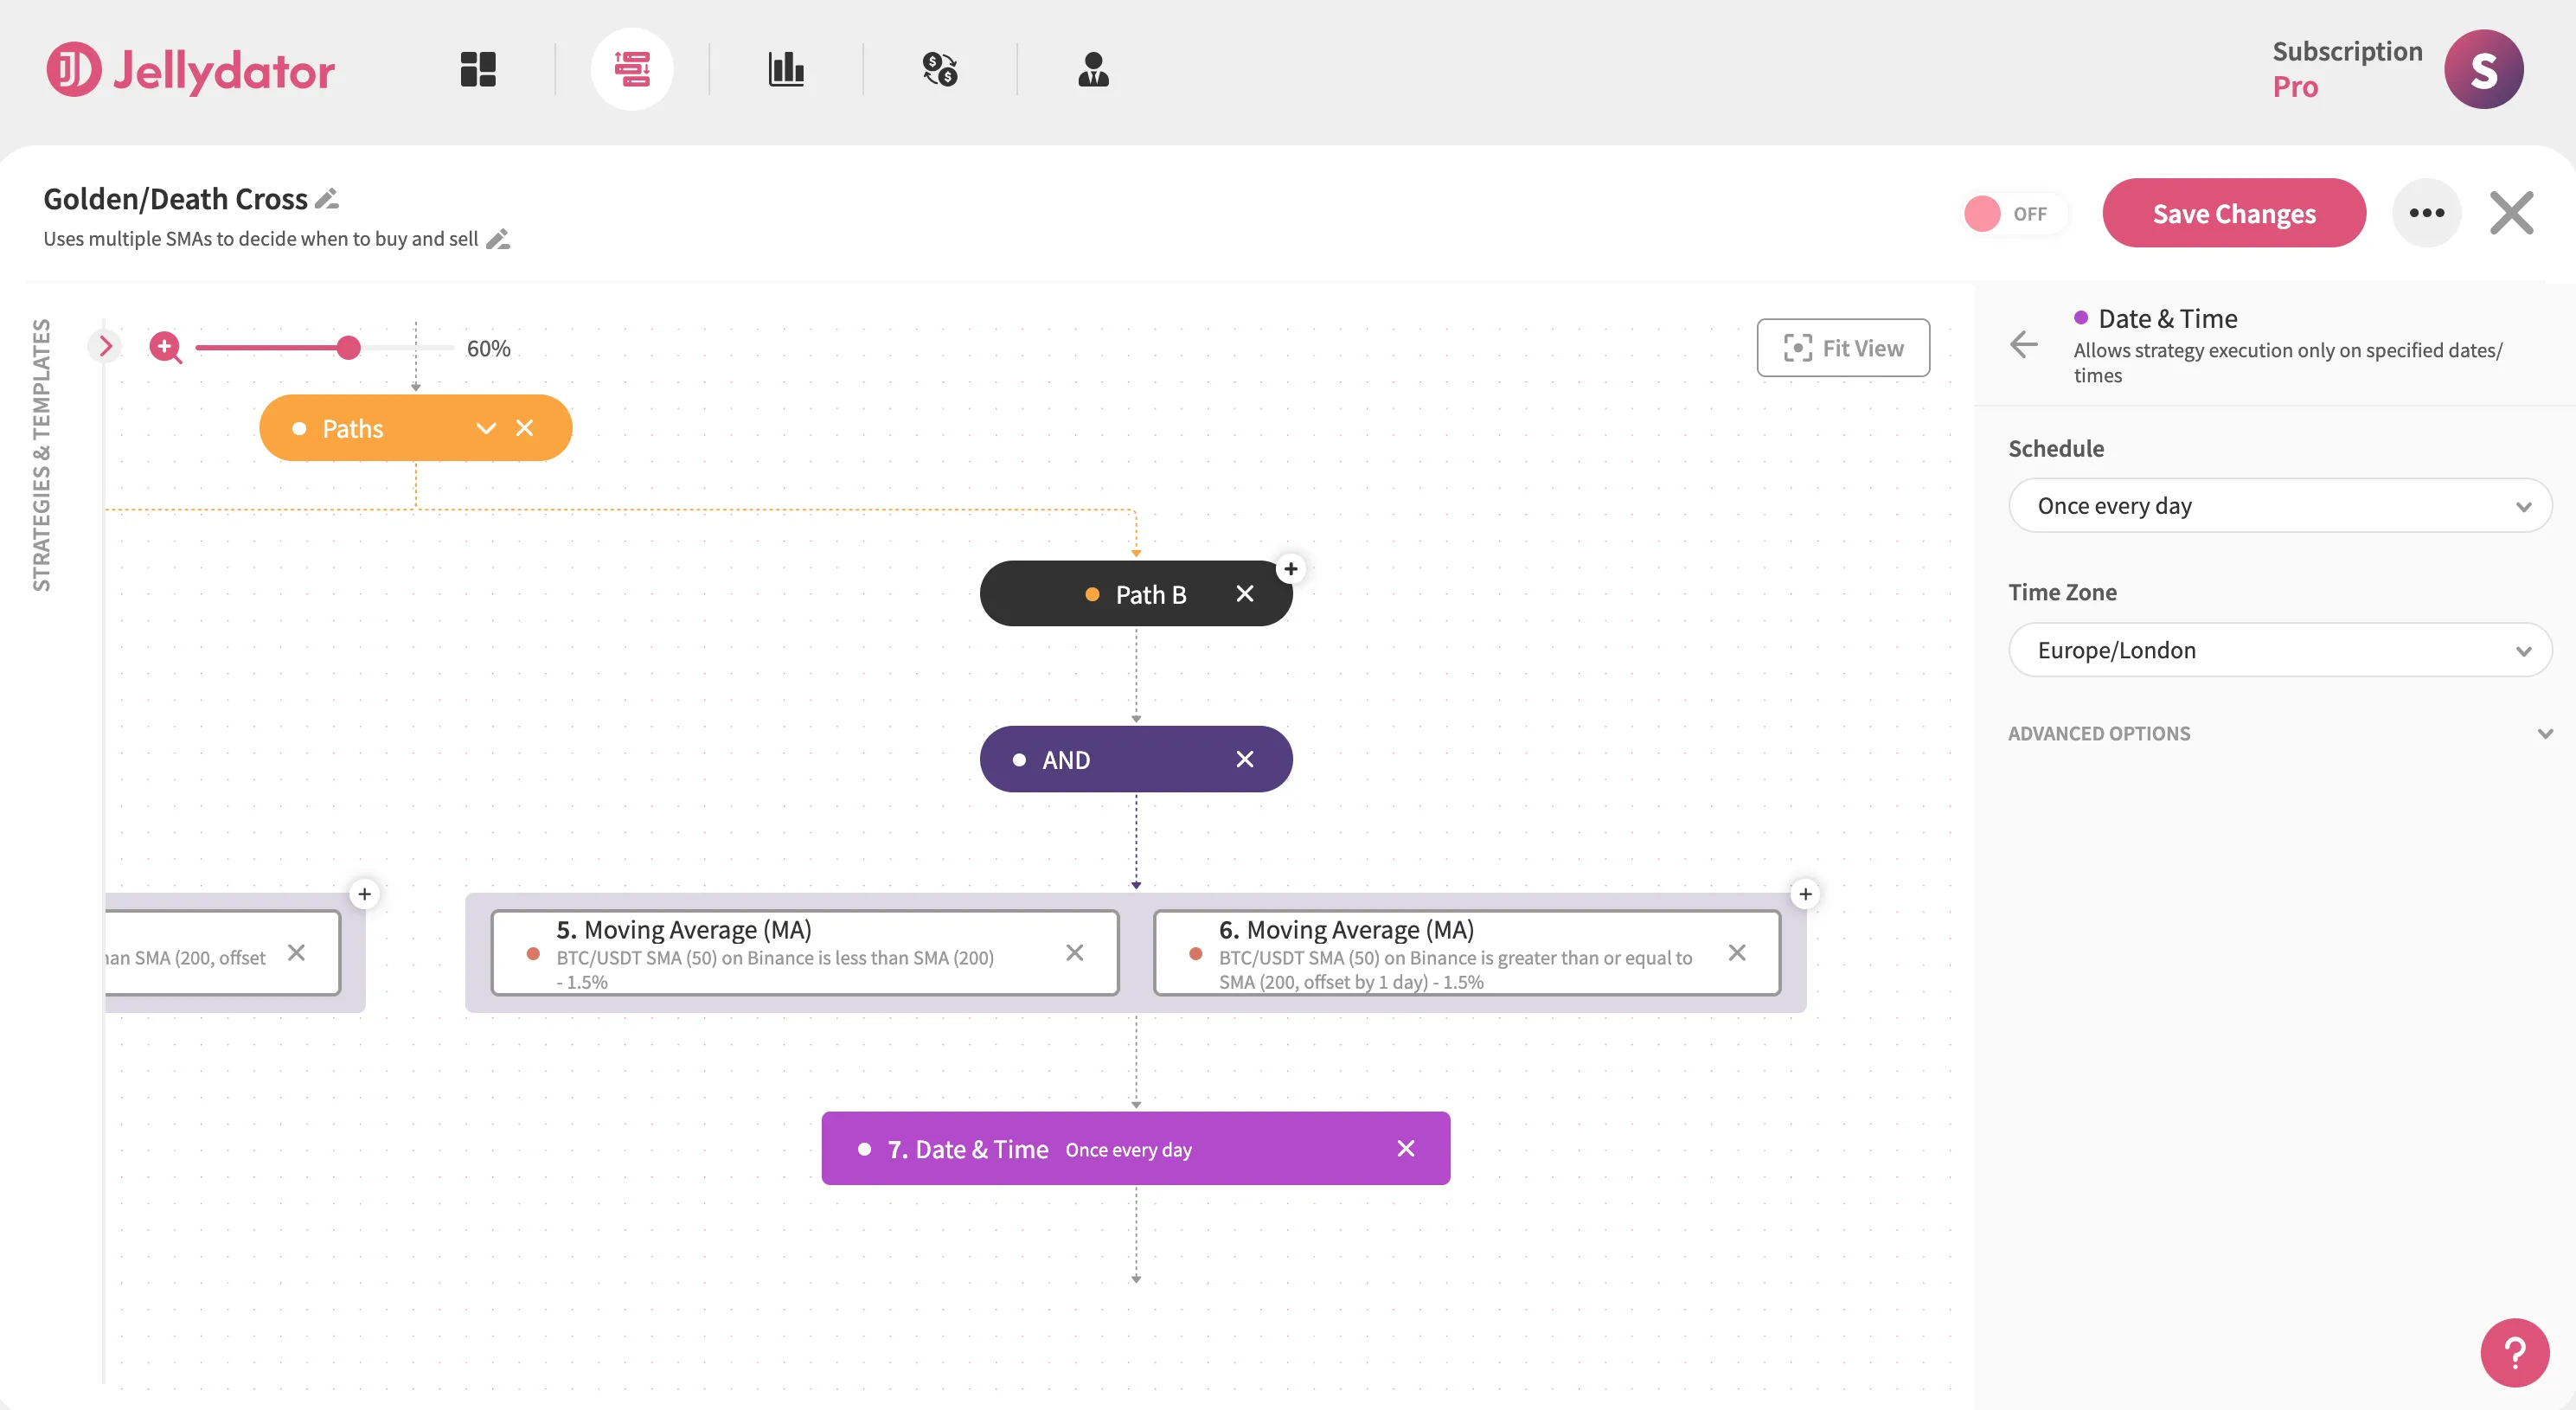
To ensure that the strategy doesn’t place multiple buy orders on the same day, add a Date & Time step beneath the AND step, with its schedule set to “Once every day”.
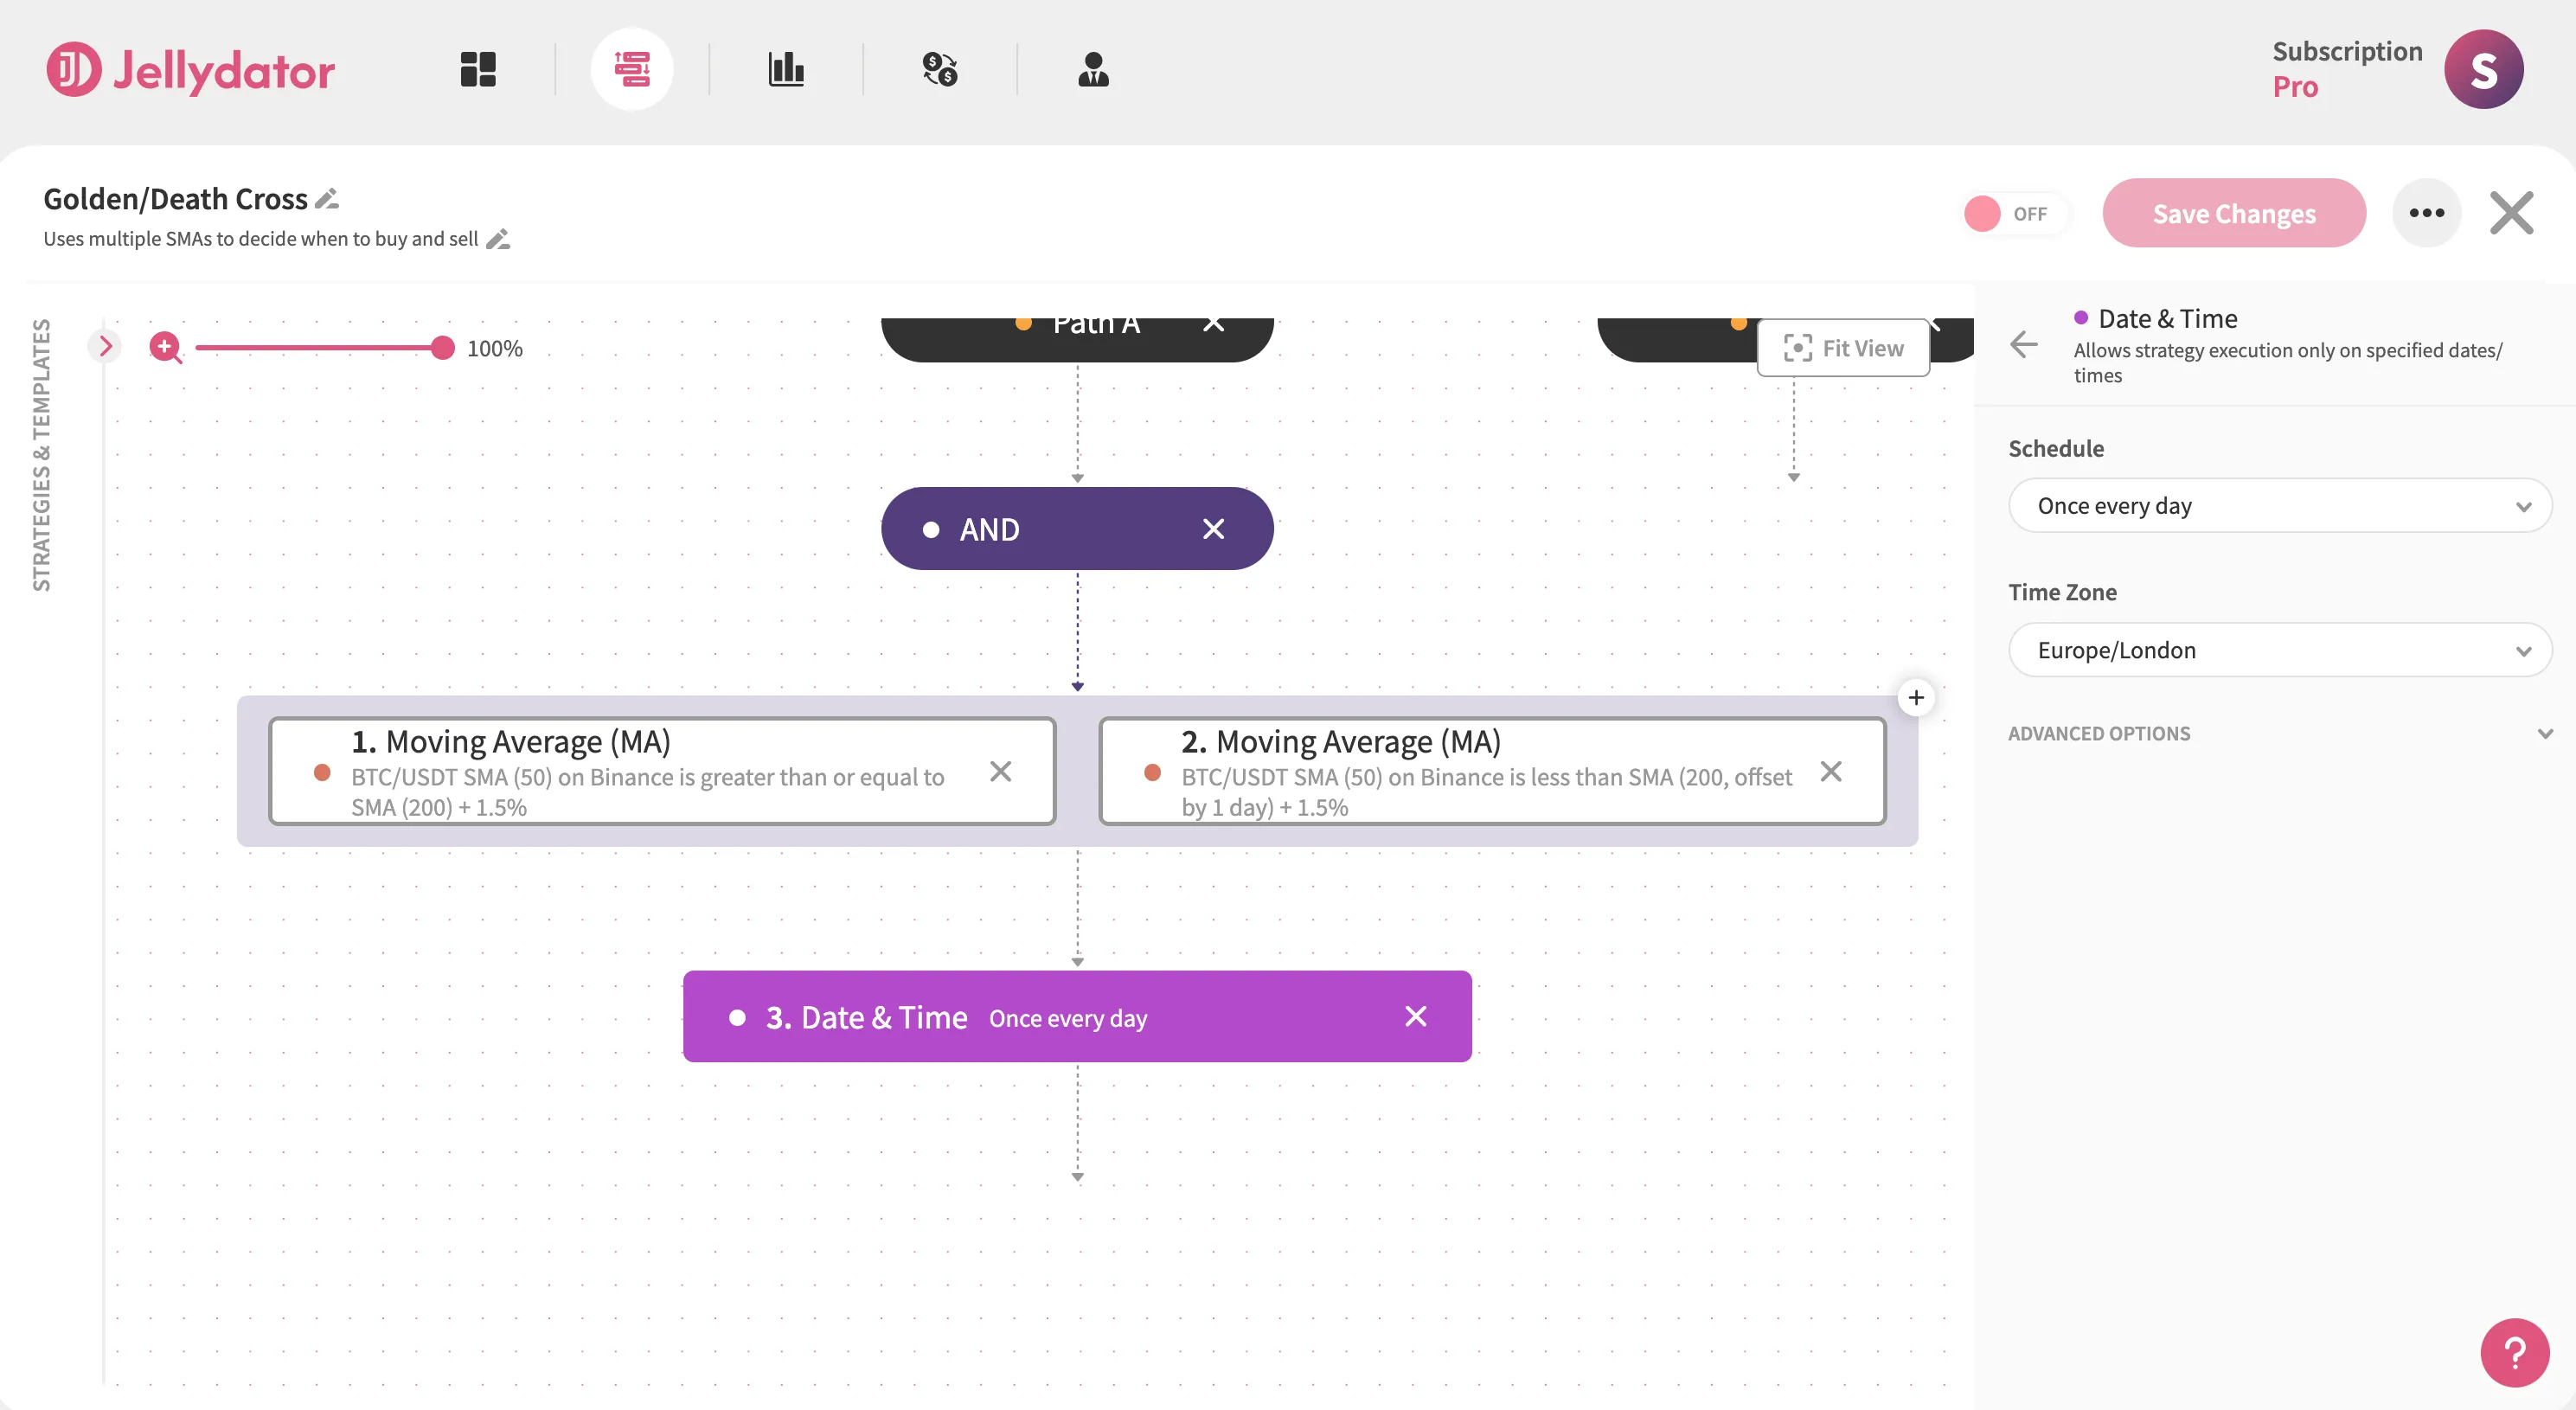
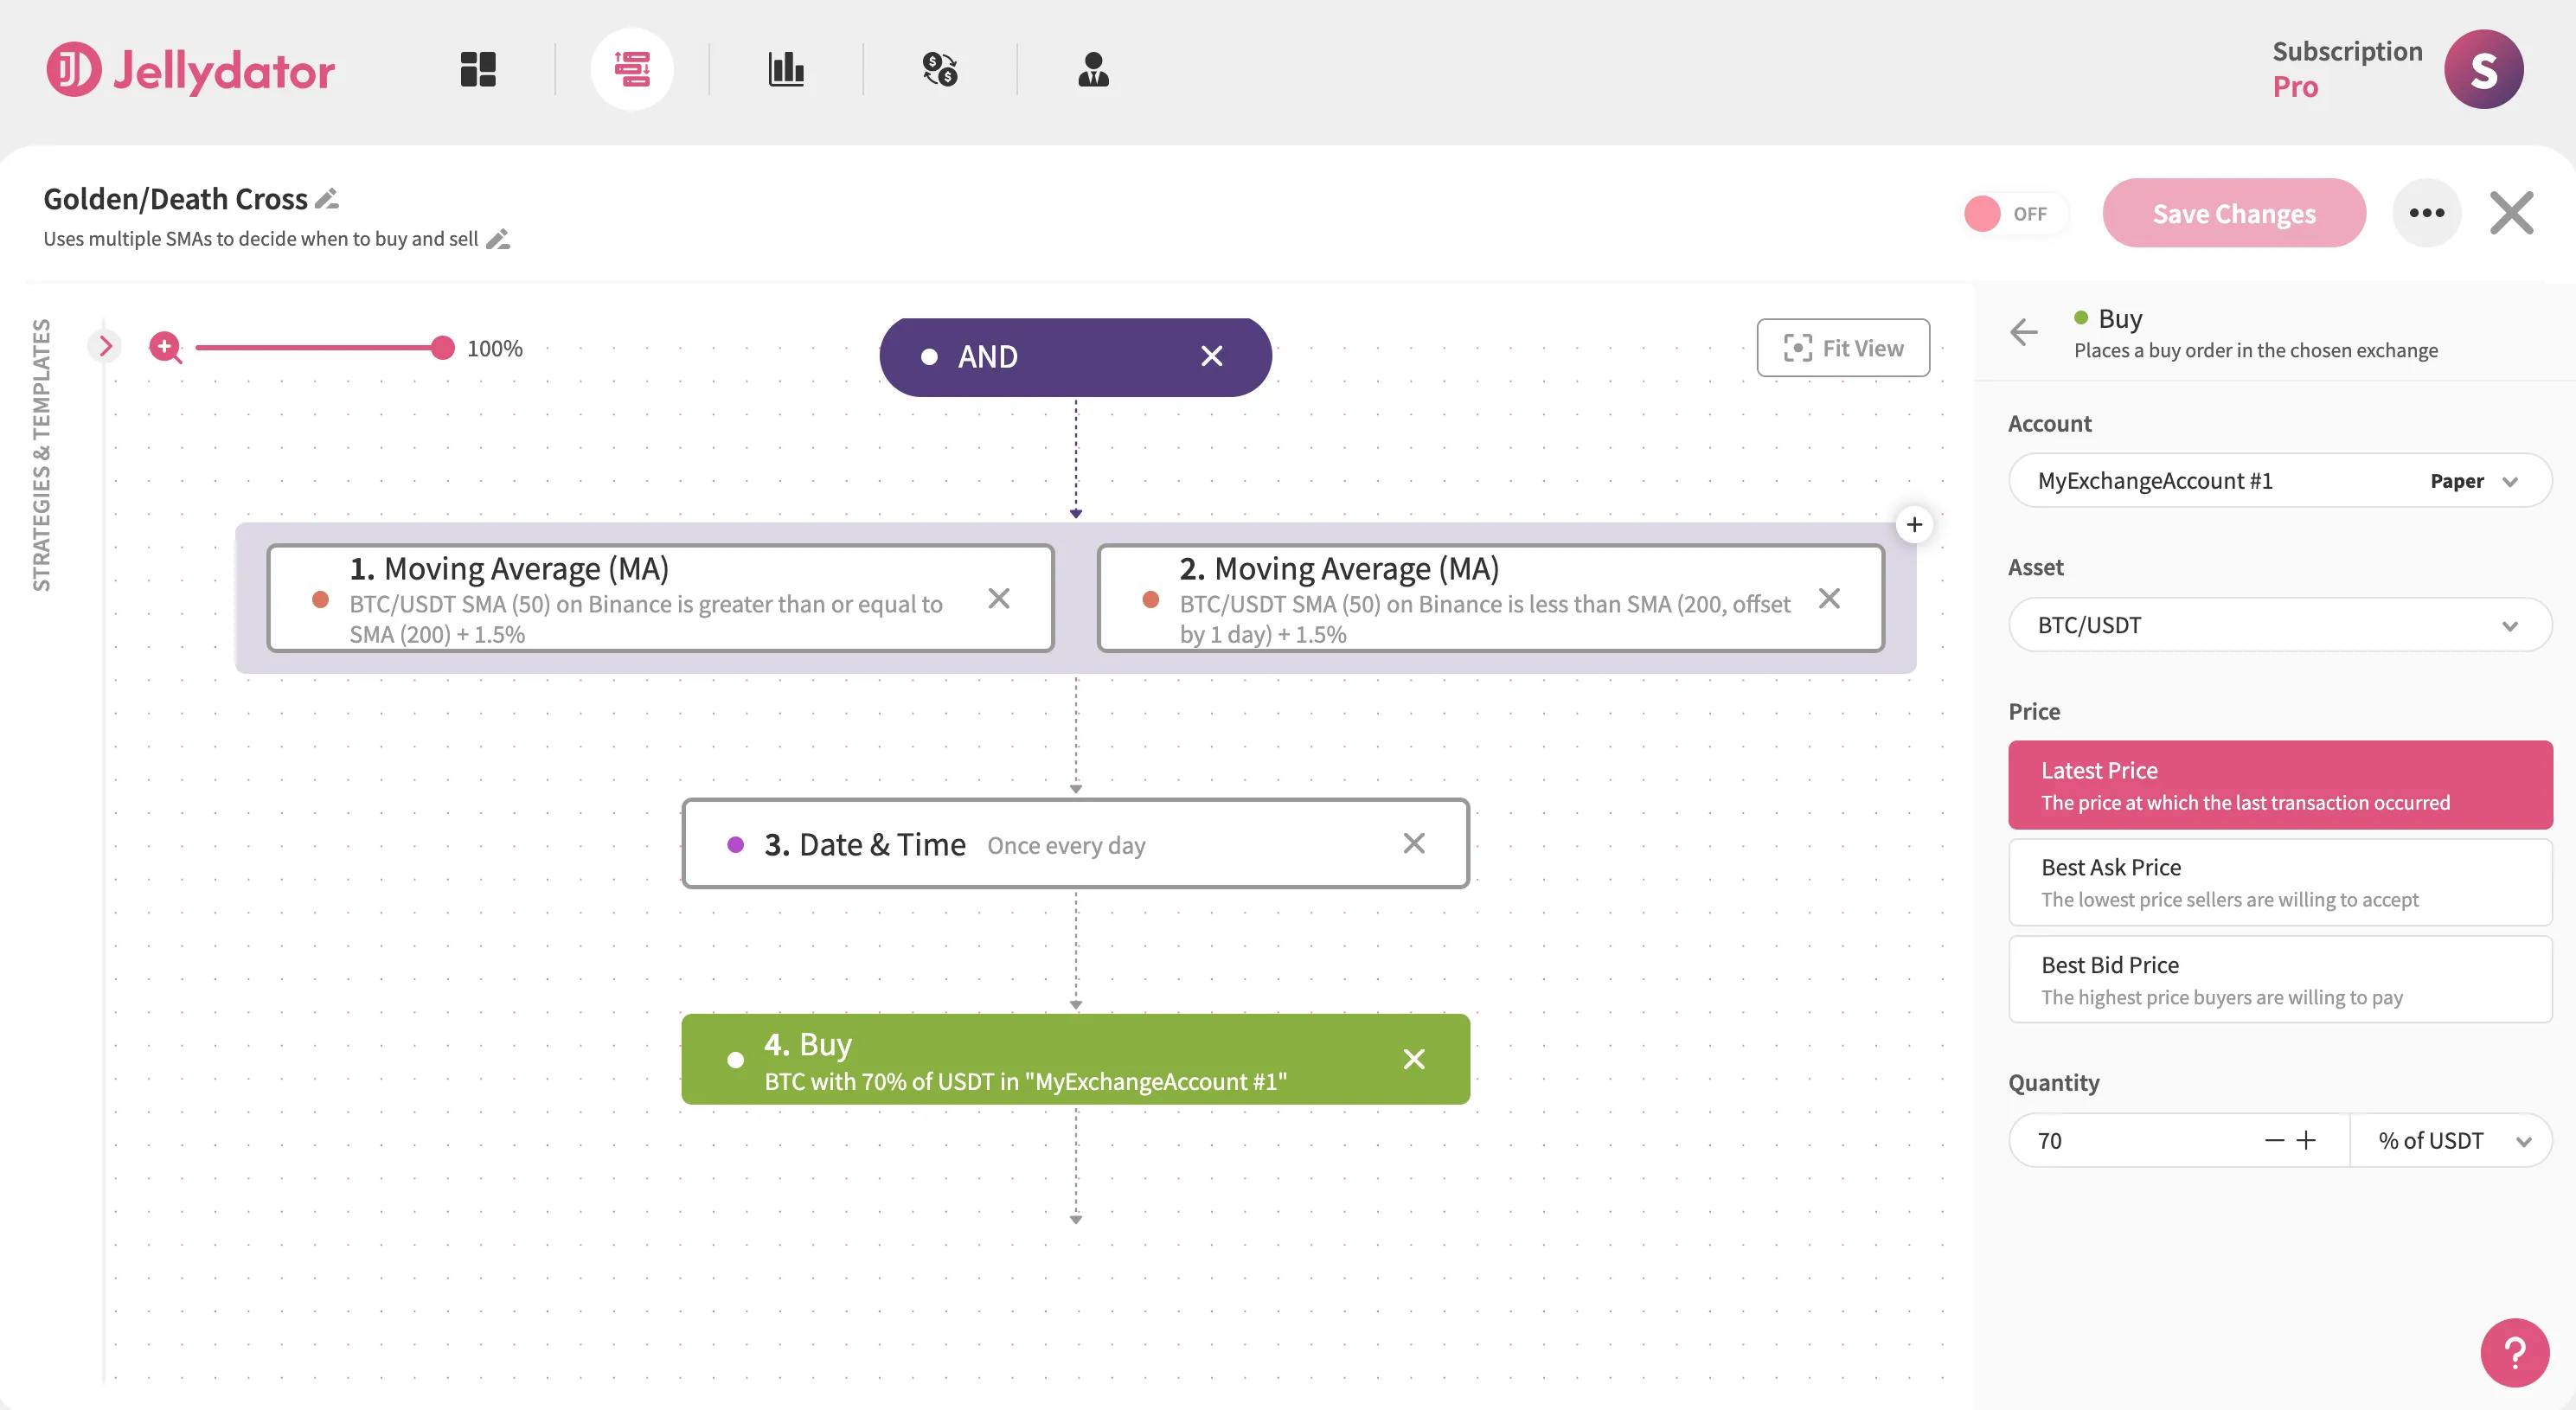
To complete this path, add a Buy step configured for BTC/USDT. In its configuration panel, select the “Latest Price” option and allocate 70% of your USDT balance.
Path B Configuration
Path B will be used to spot the Death Cross. In it, add another AND step. Just like in Path A, It will be used to group two Moving Average steps.

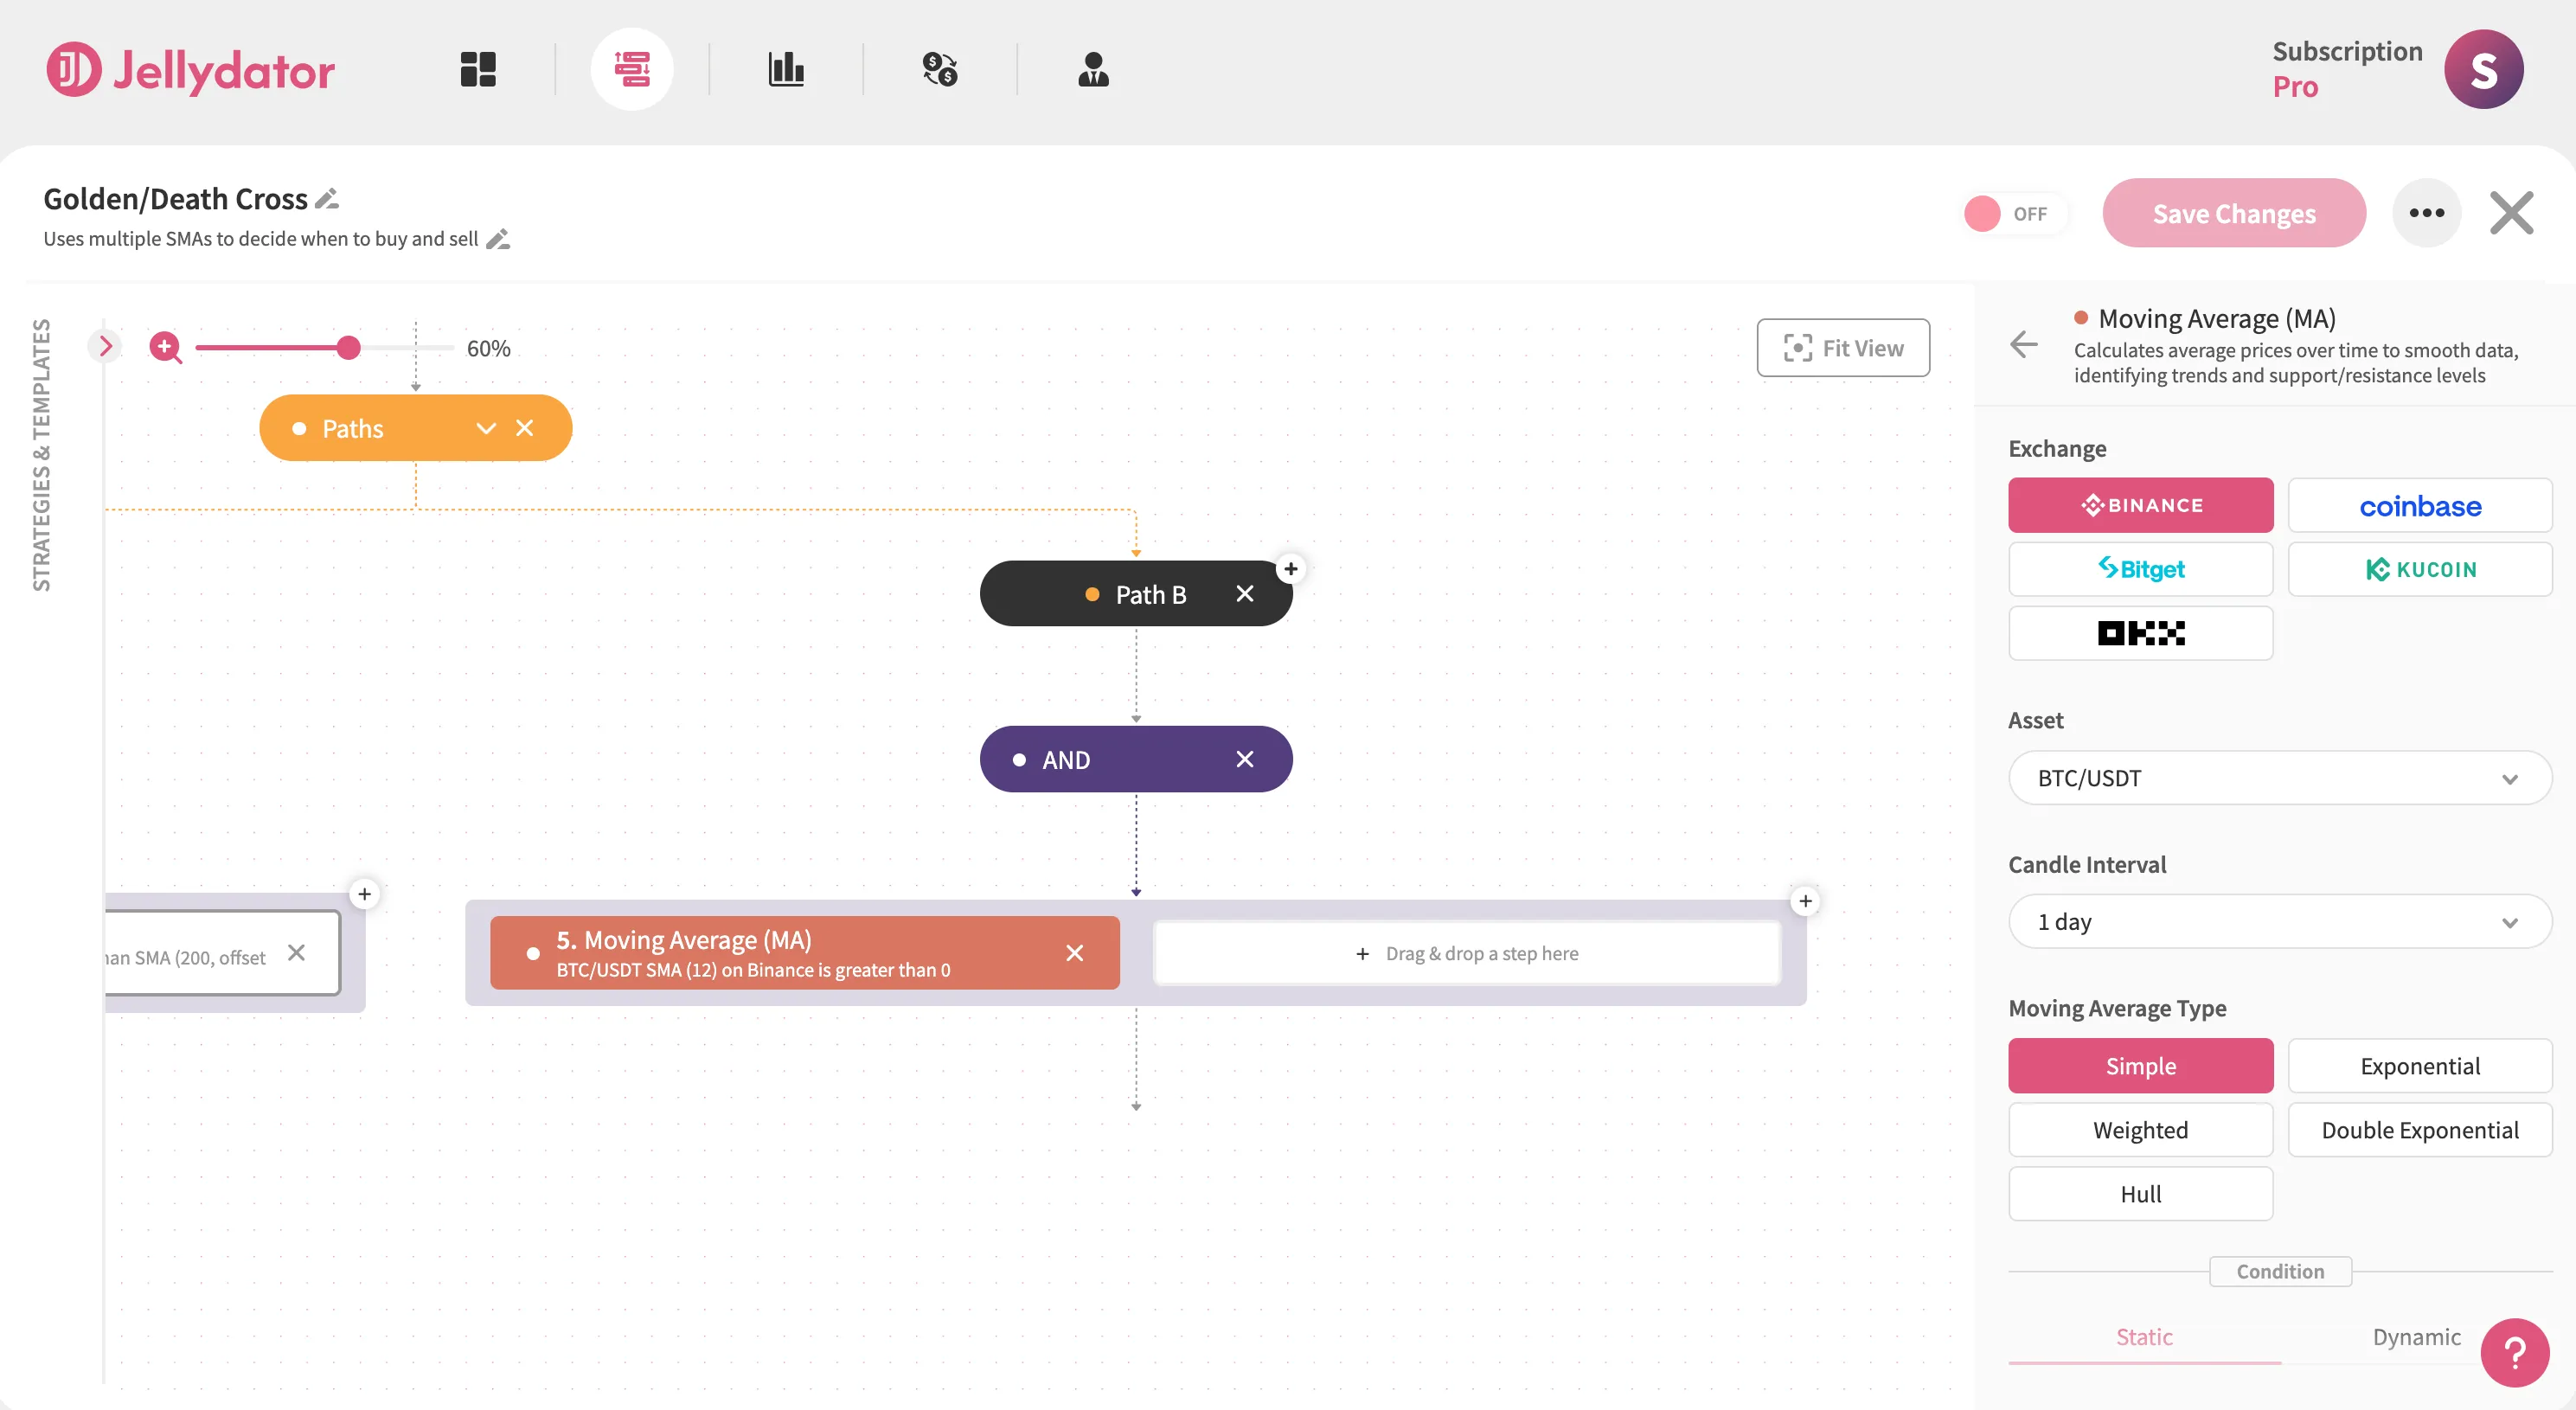
Inside the AND step in Path B, add the first Moving Average step and select it to open the configuration panel. Just like before, ensure the indicator calculates and uses the Simple Moving Average (SMA) for your target asset (we’ll use BTC/USDT in this guide). Then, select the 1-day candle interval.
Scroll to the “Condition” section, choose the “Dynamic” option, then set “Simple Moving Average” as the condition target. Select Less as the operator to establish the “Short SMA < Long SMA” condition.
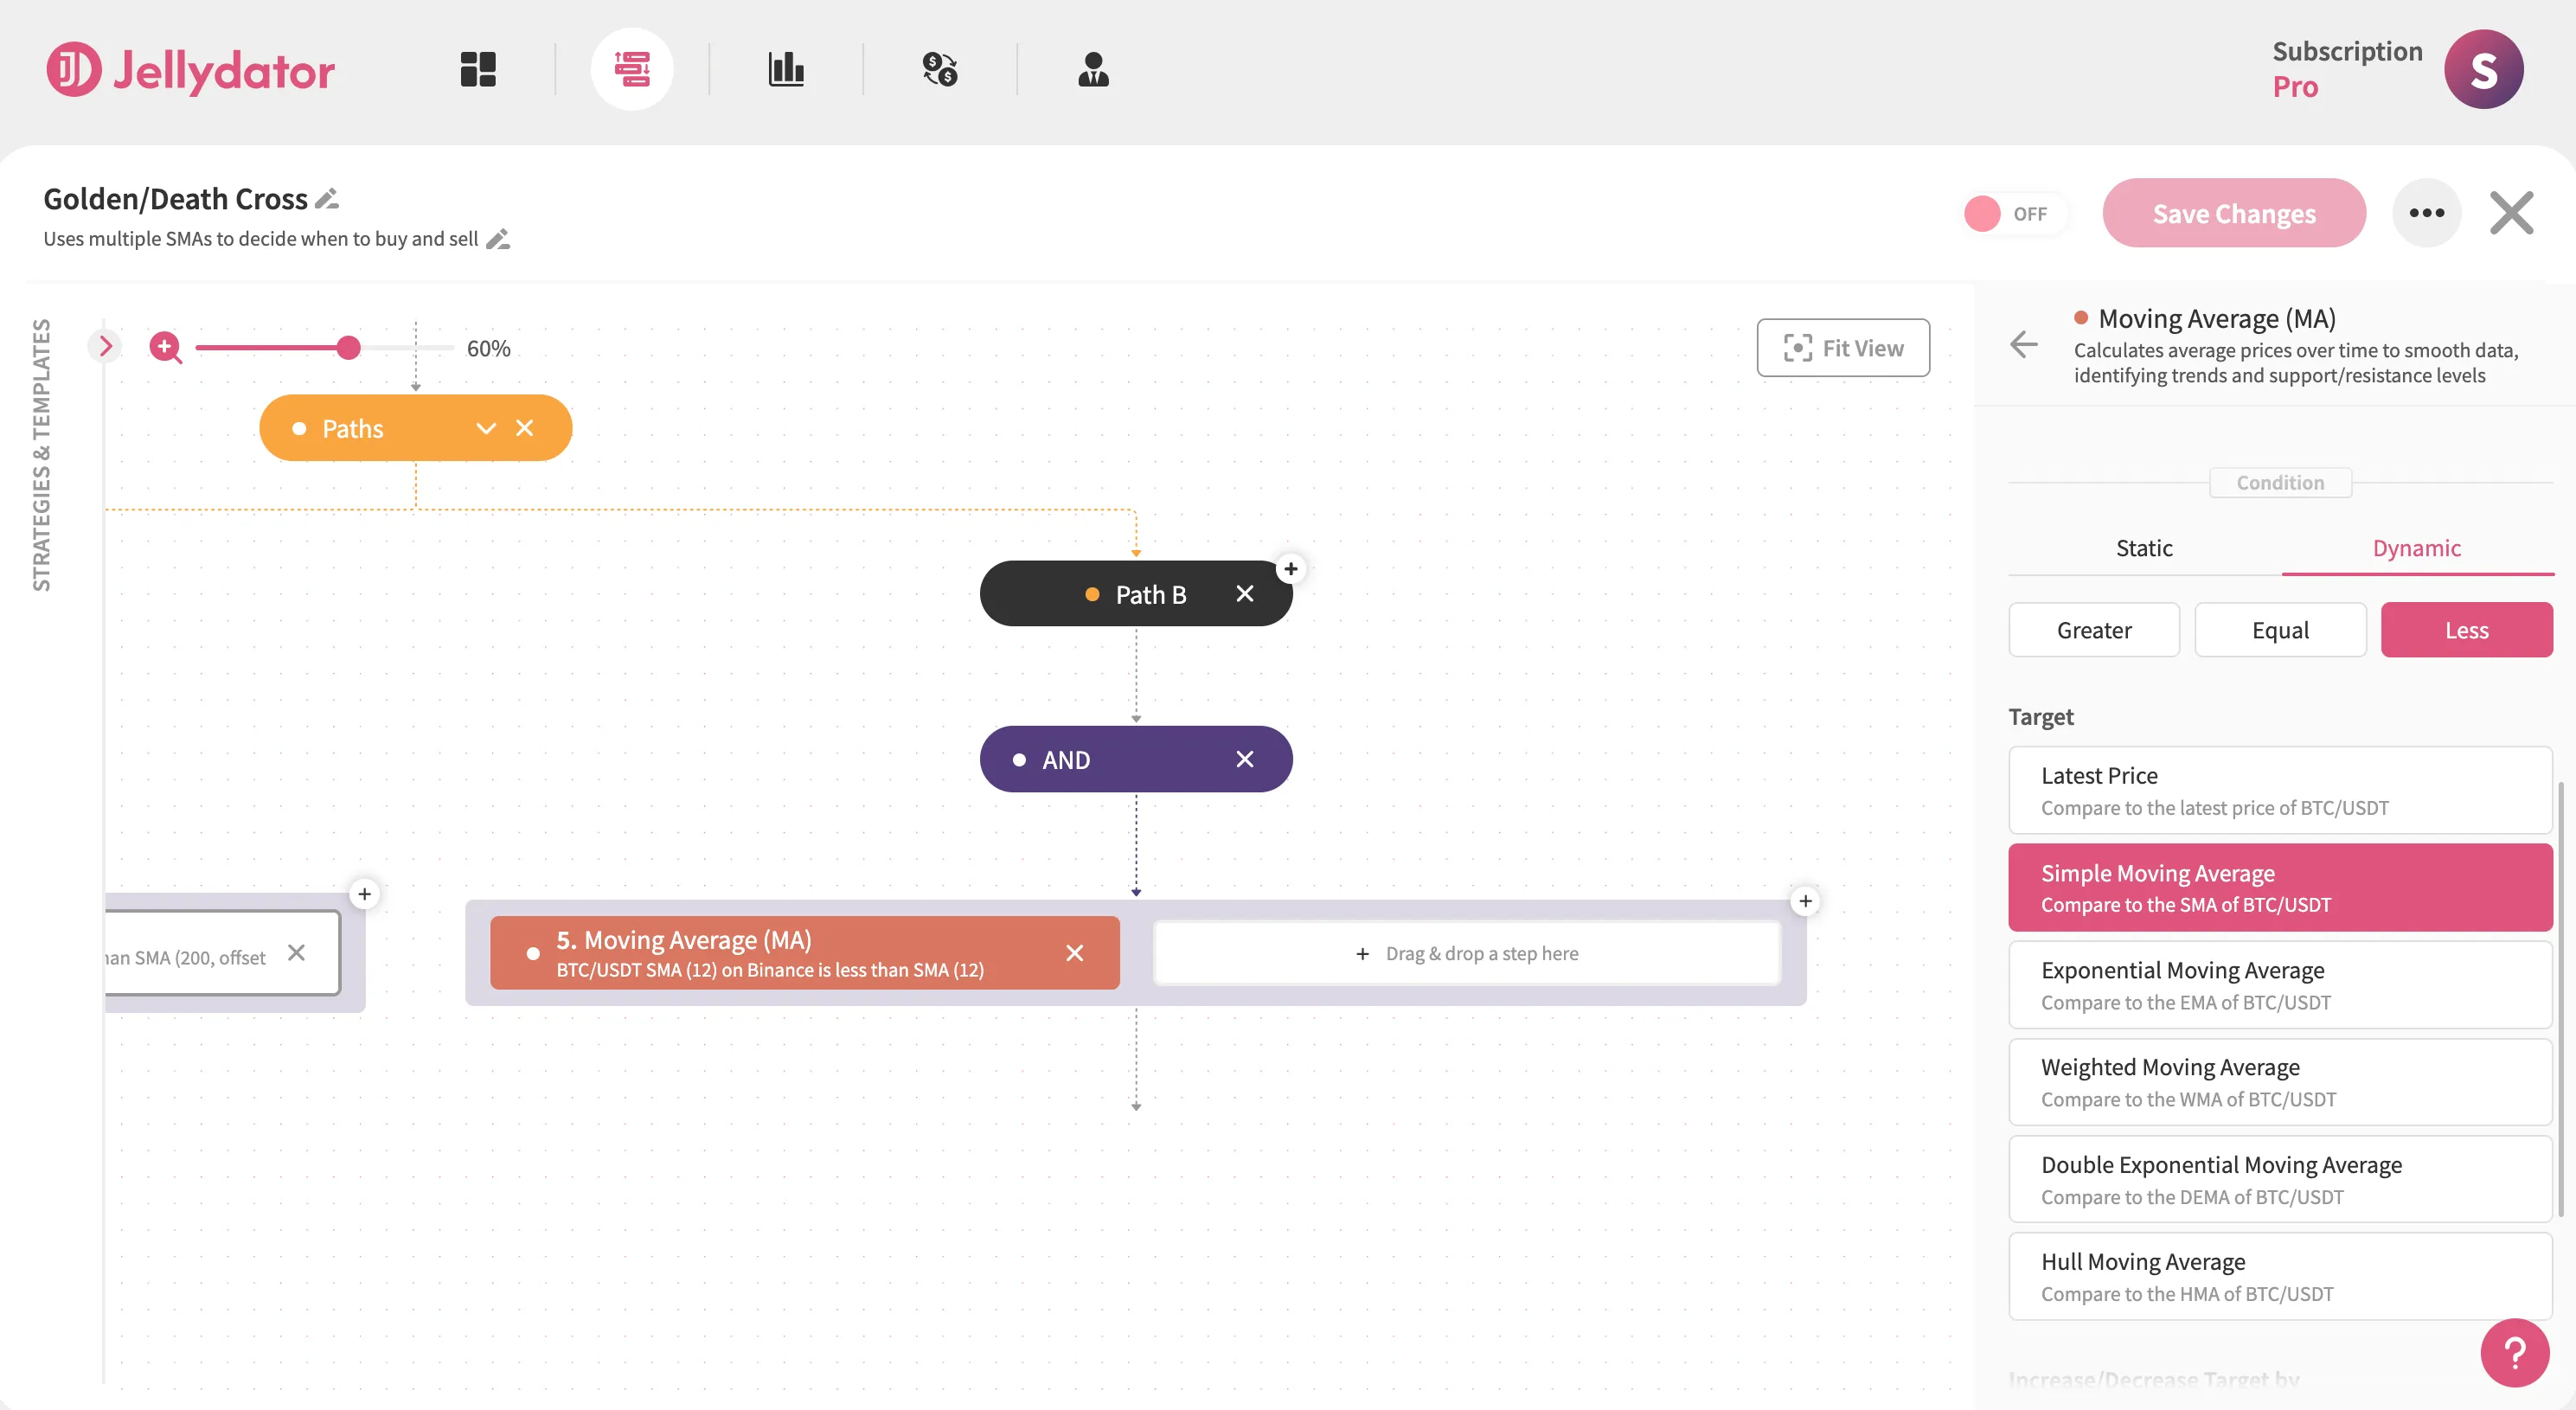
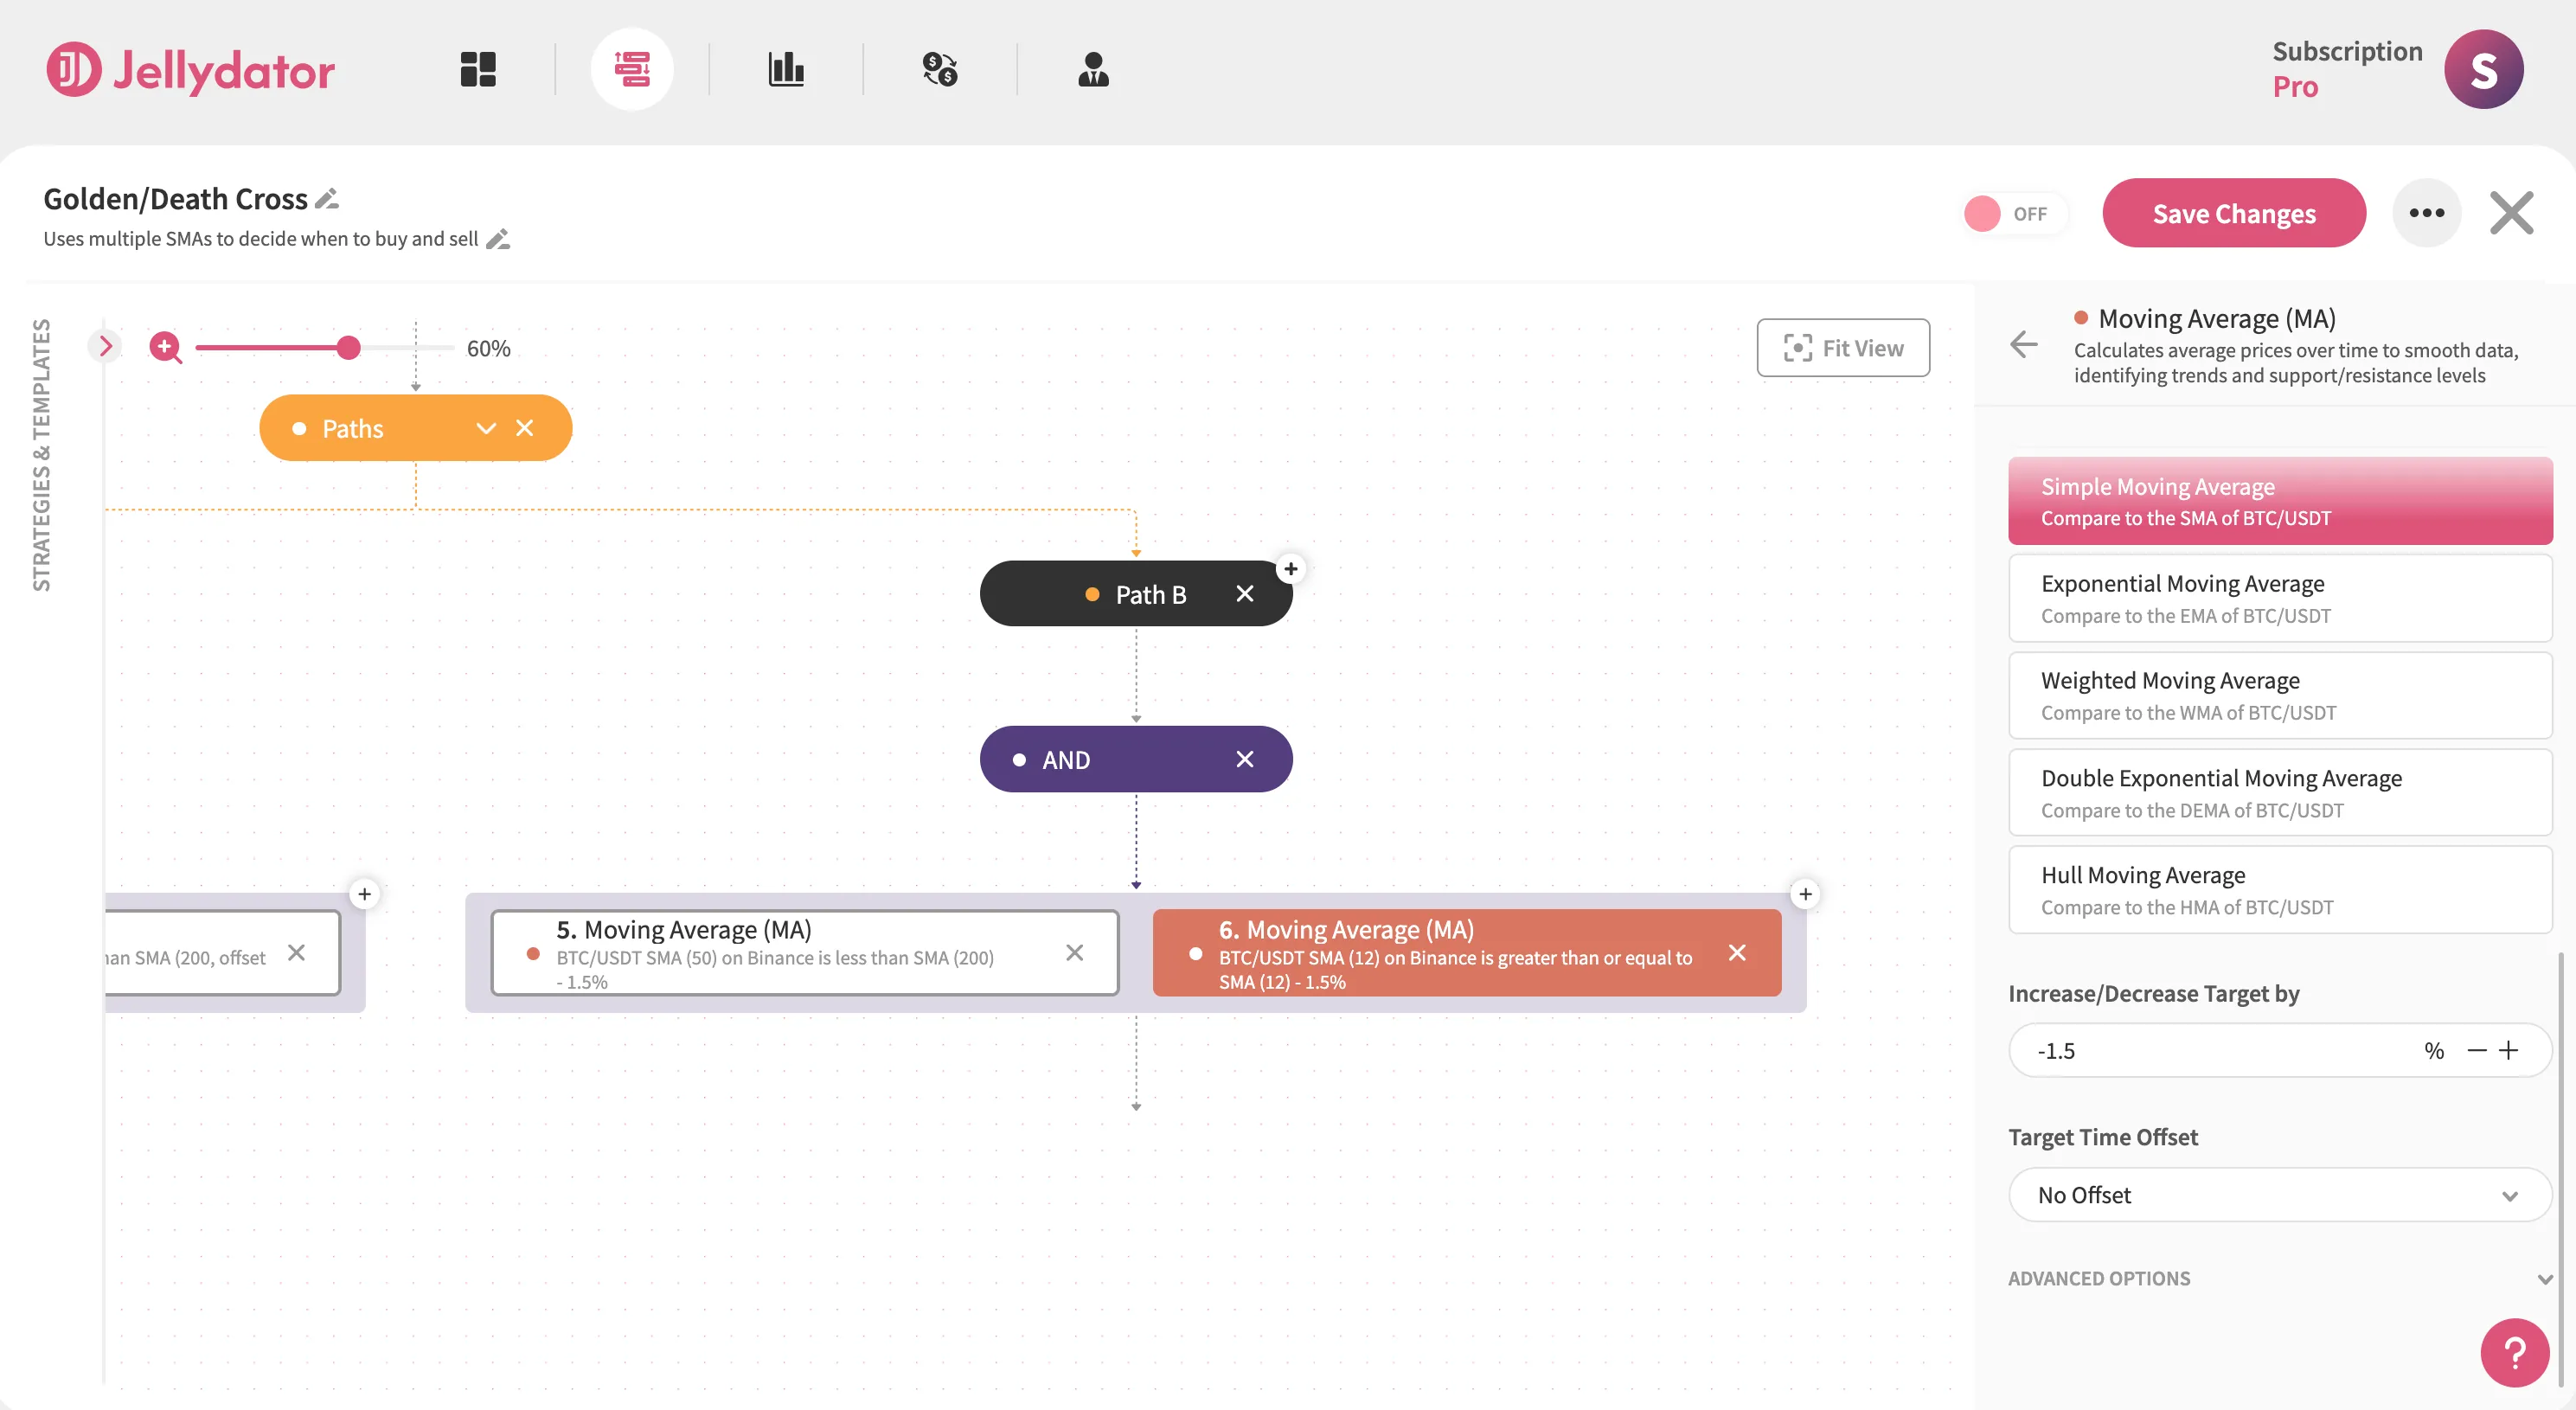
In the “Increase/Decrease Target by” input field, enter “-1.5”. This means that we want the short SMA to be less than the long SMA decreased by 1.5%. This helps reduce the number of false signals generated when the short SMA touches and then immediately rises above the long SMA again.
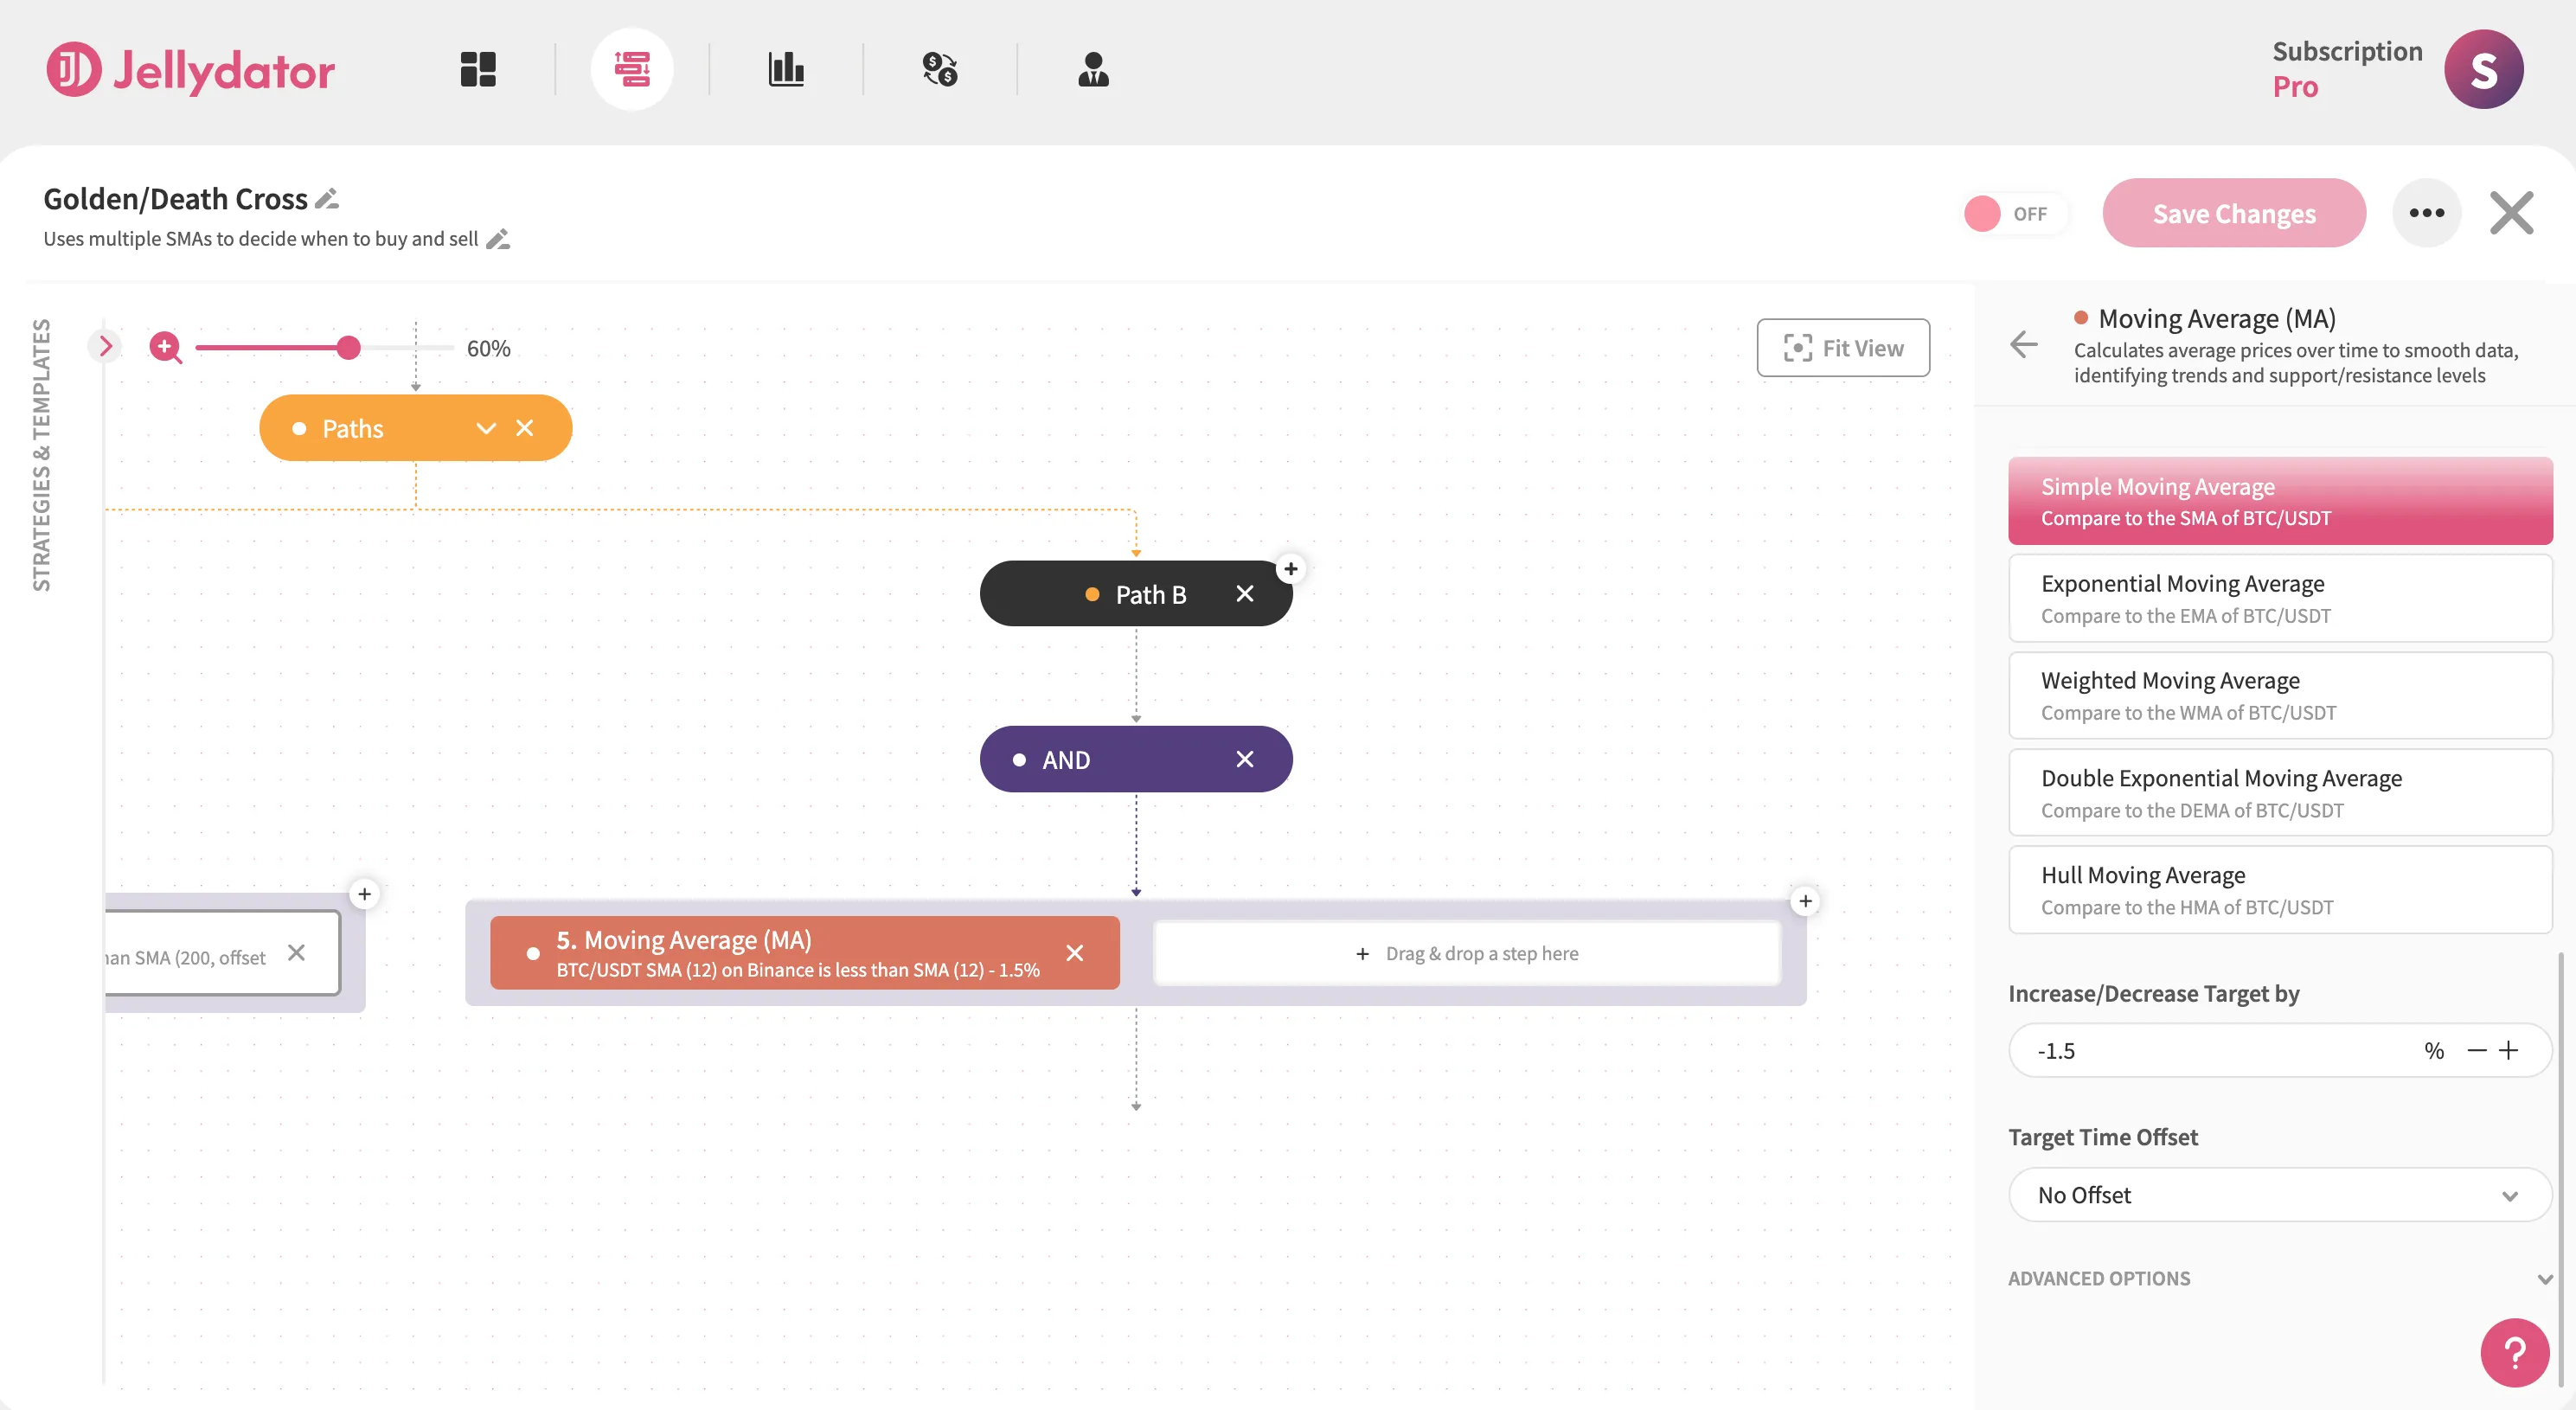
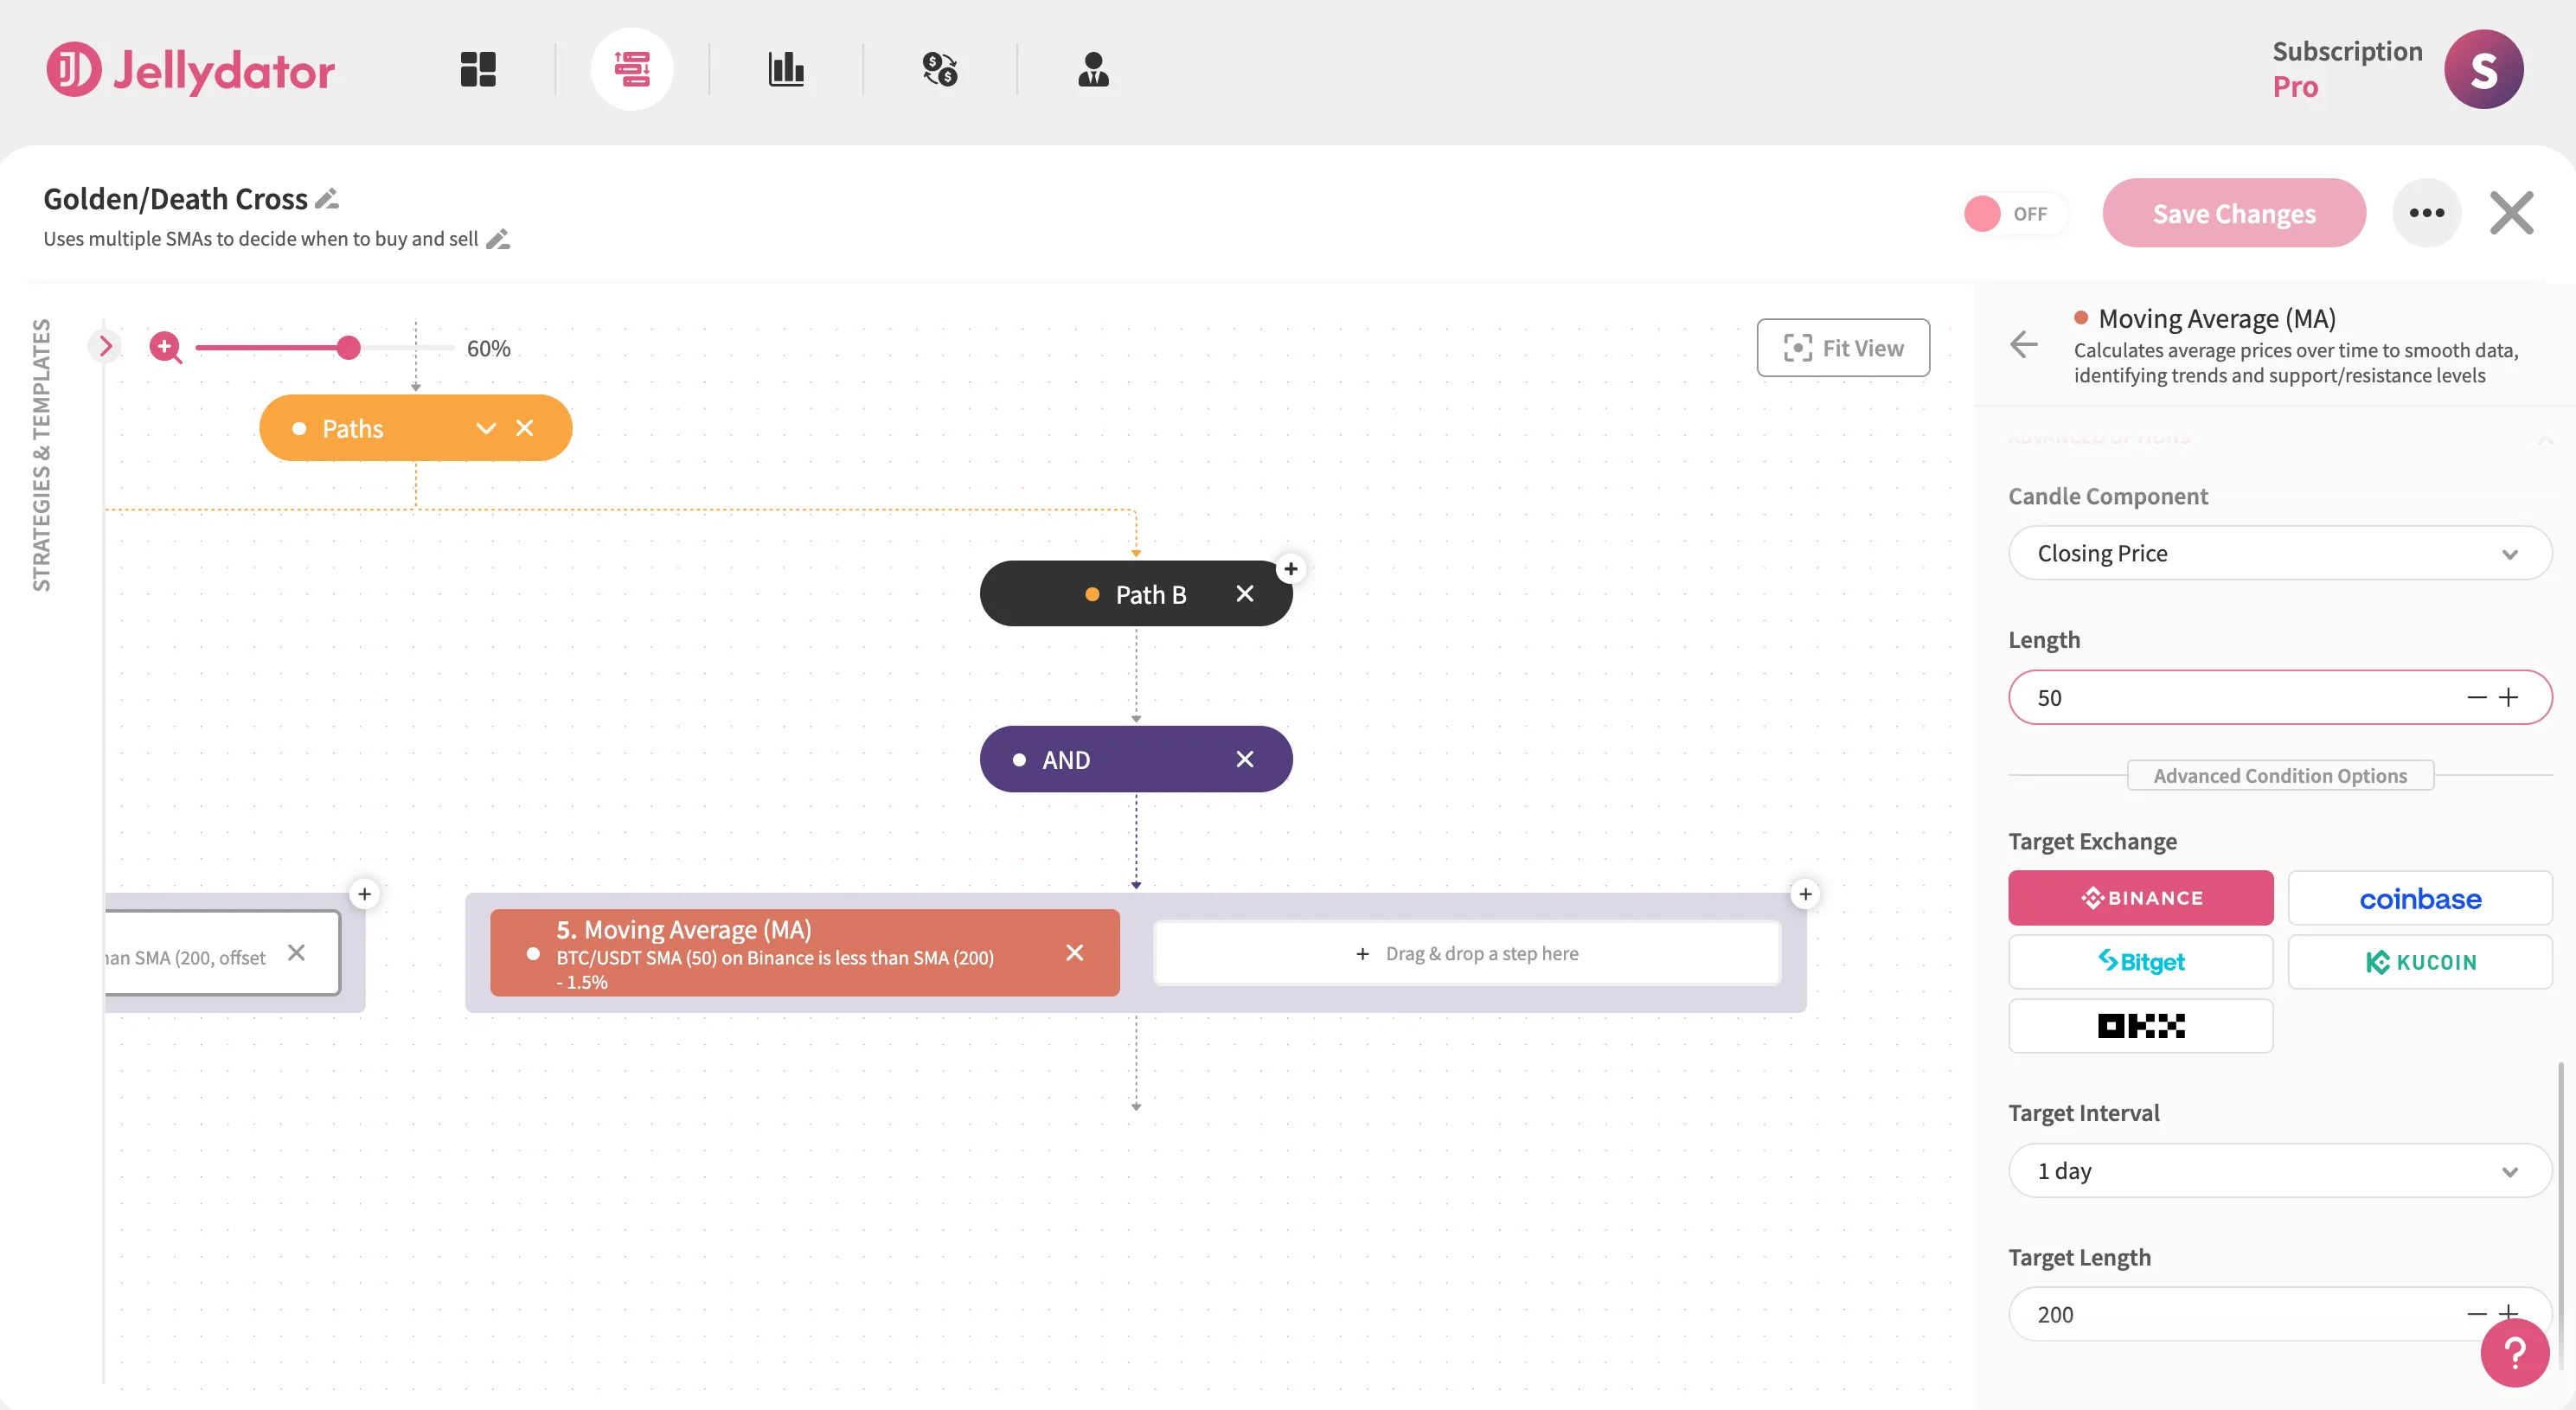
Next, click on the “Advanced Options” button. Once the “Advanced Options” section appears, set the “Length” to 50 (this is the length of the short SMA) and the condition “Target Length” to 200 (the length of the long SMA).
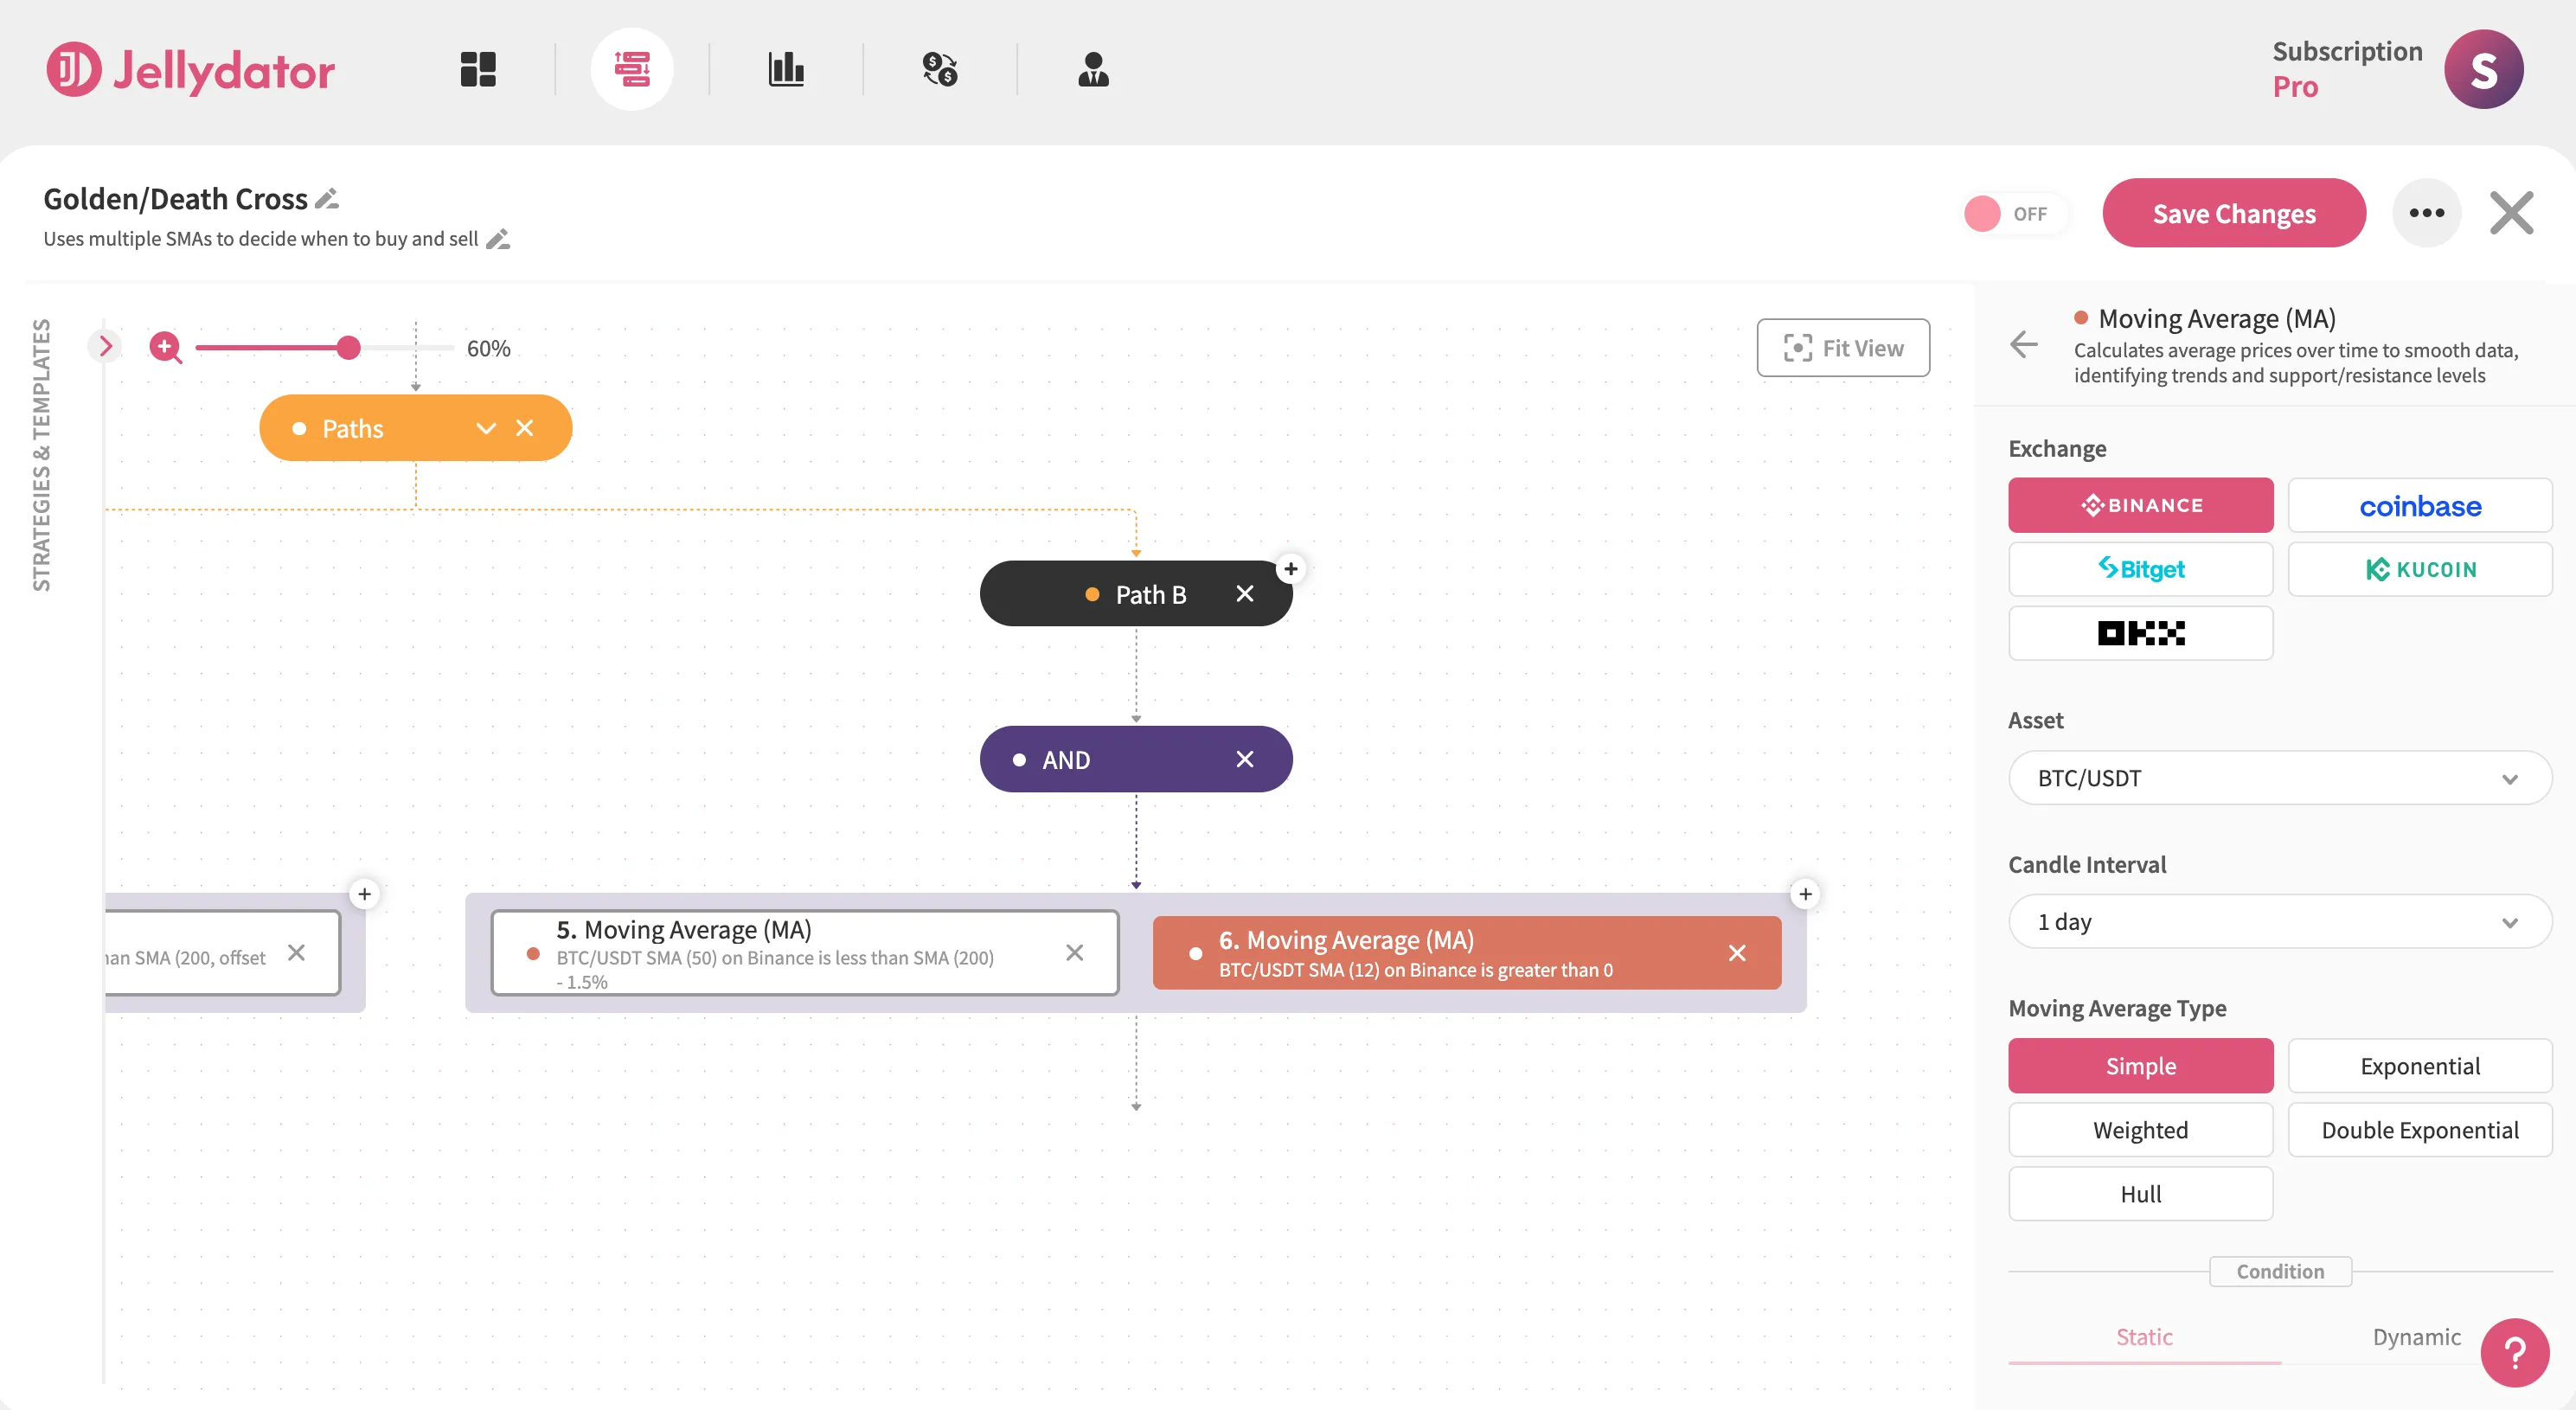
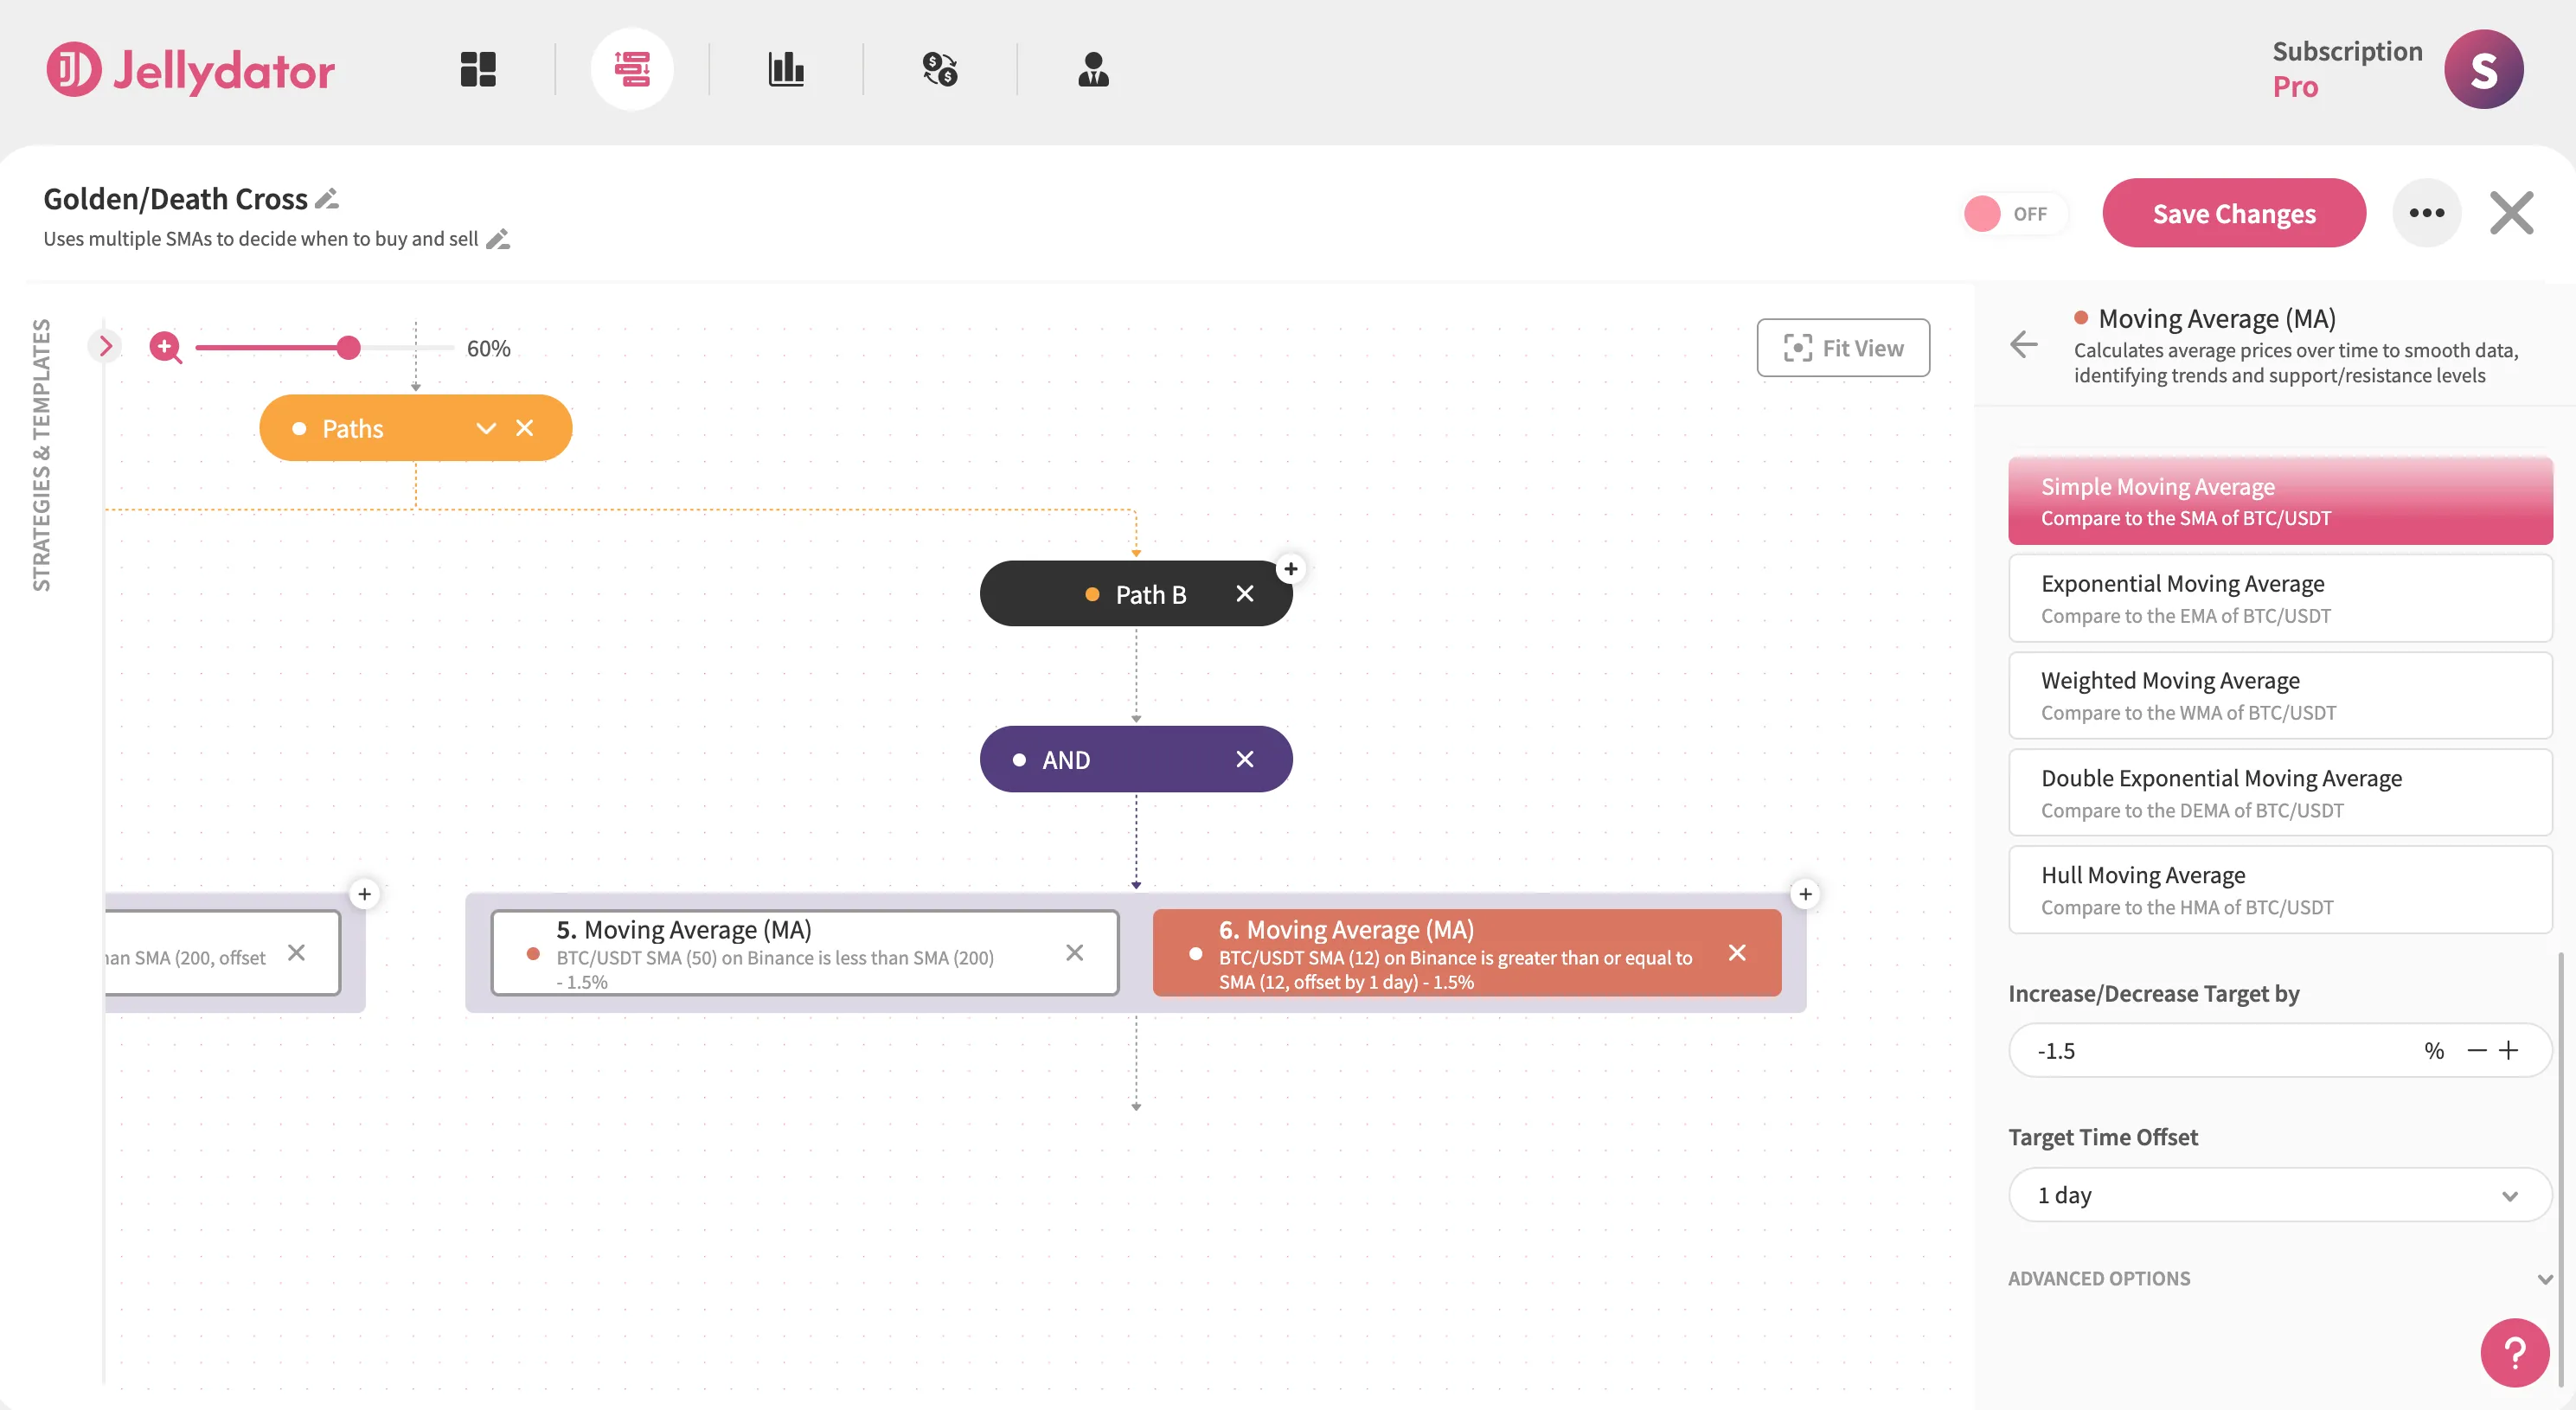
Add the second Moving Average step inside the AND step in Path B, and then select it to open the configuration panel. Again, the purpose of the second Moving Average is to ensure that the cross didn’t occur in the previous period and that it happened only in the current one. To do this, use the same BTC/USDT pair, a 1-day interval, and the Simple moving average type.
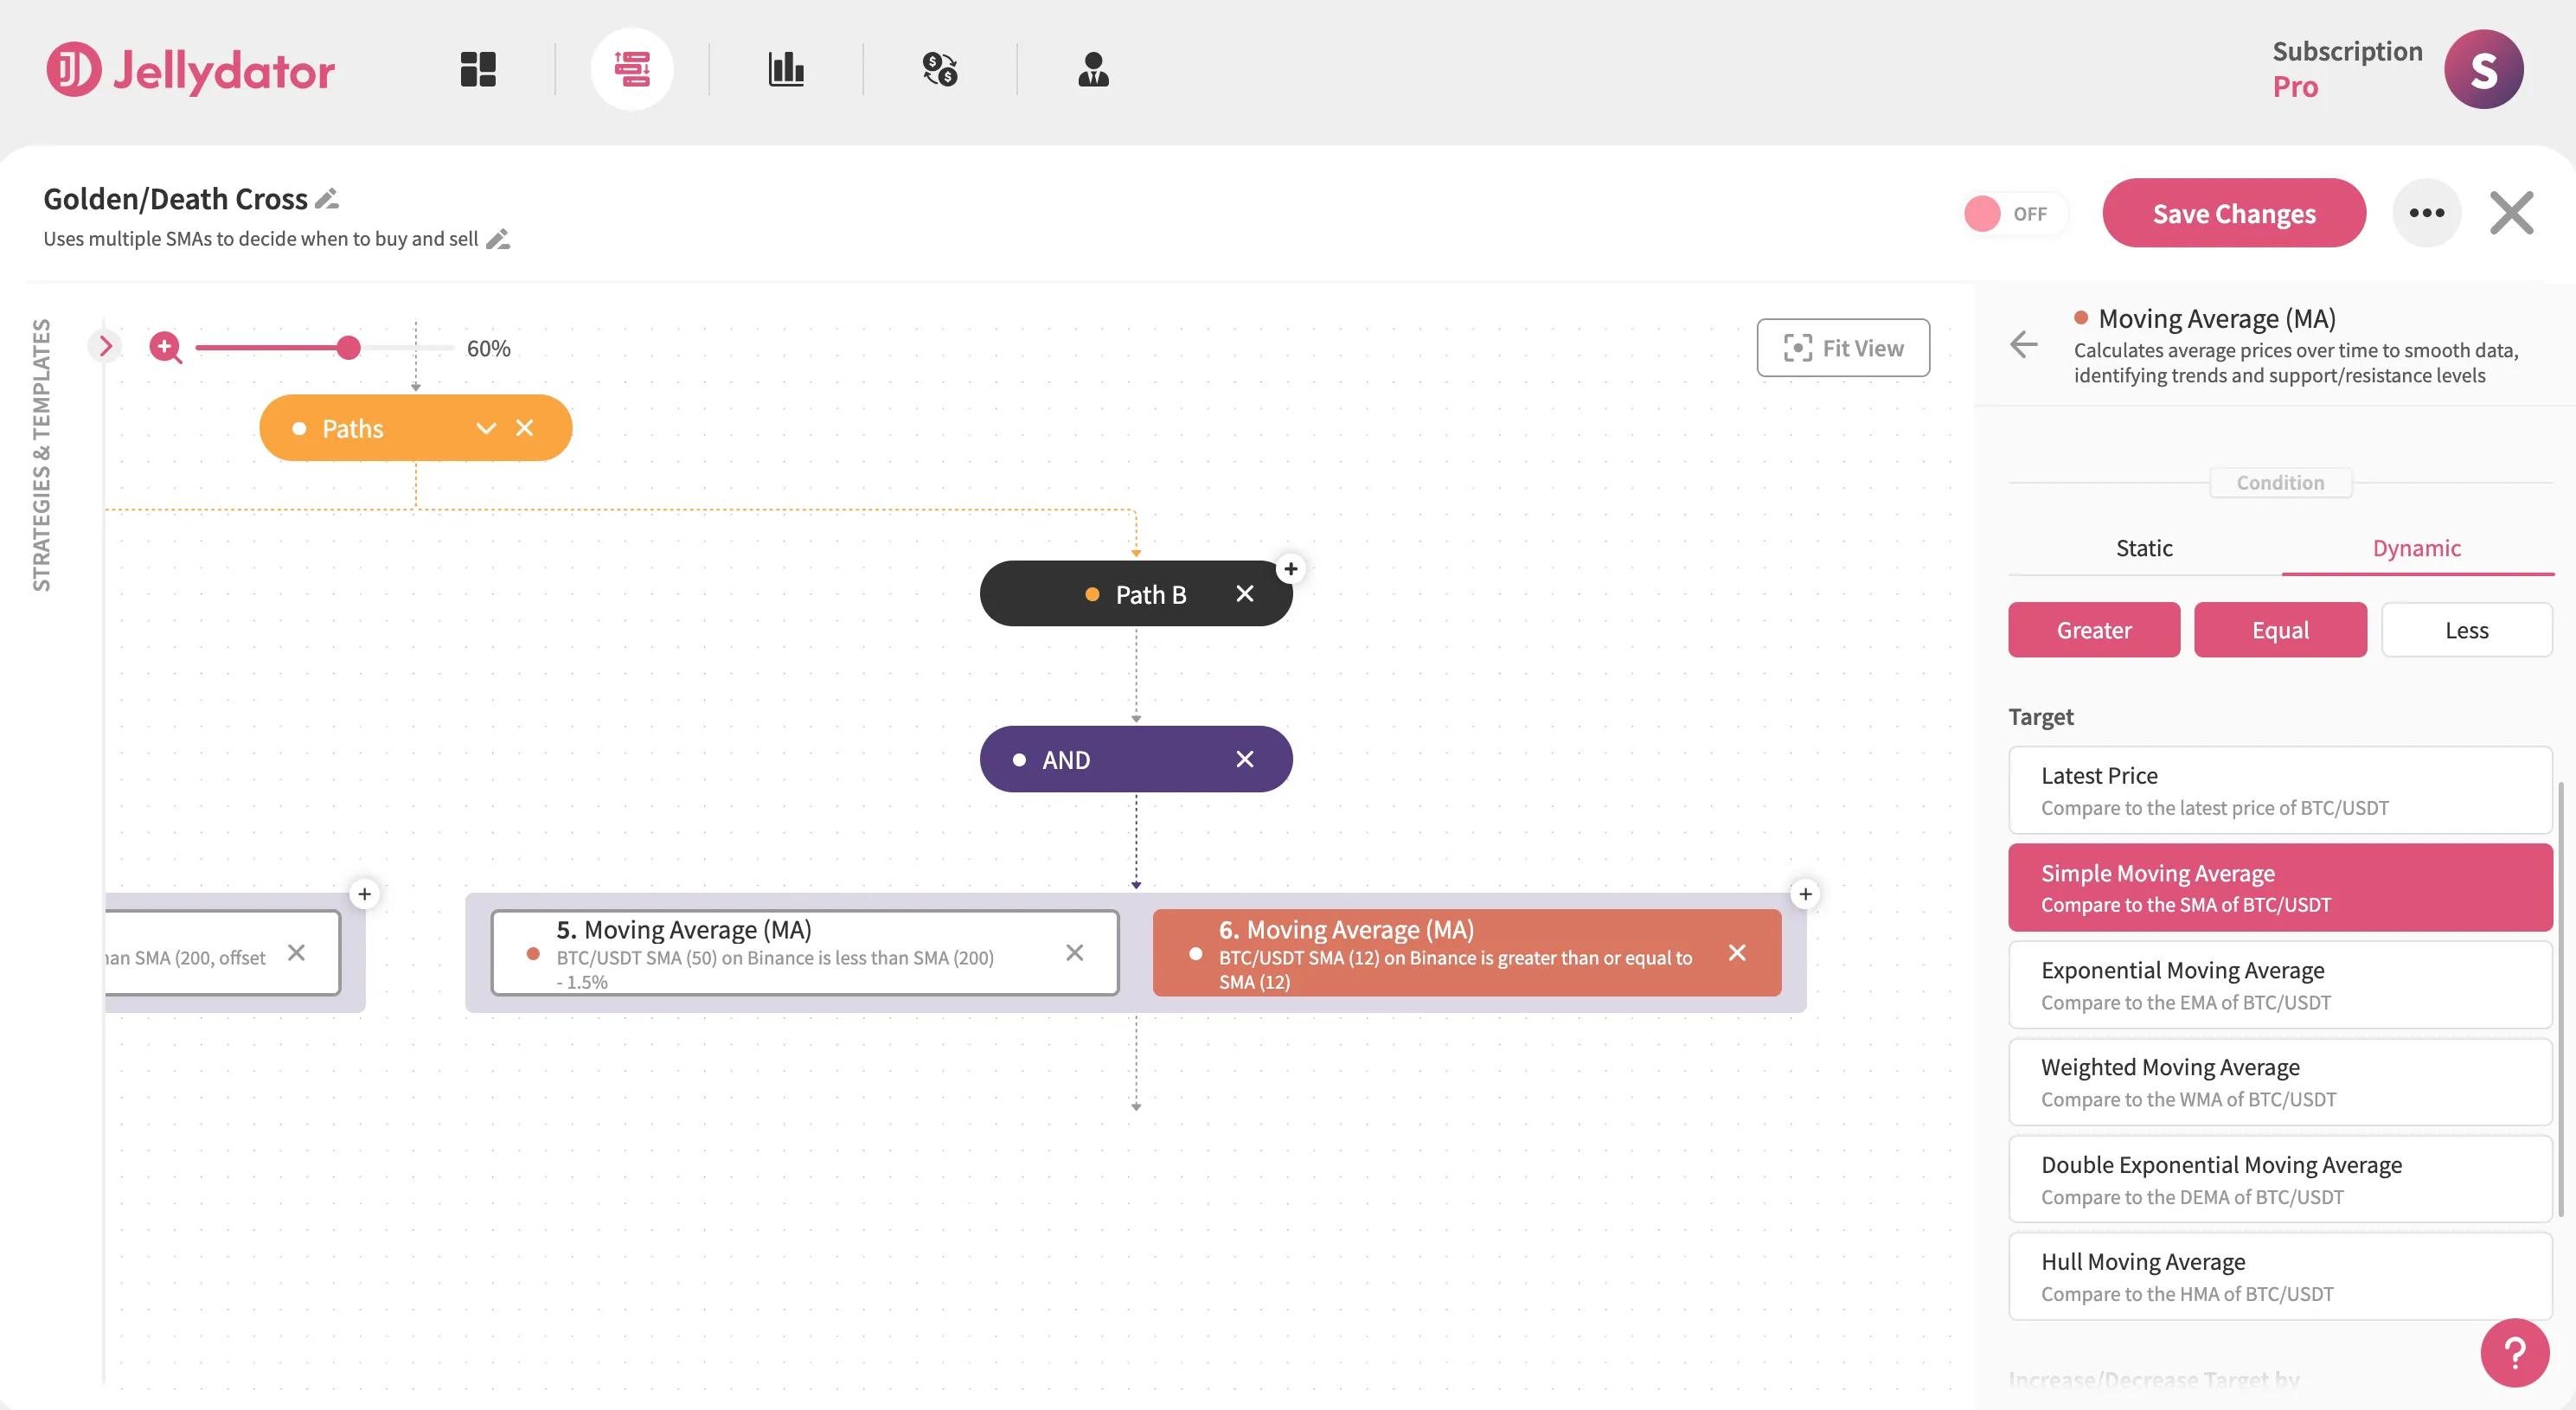
Scroll to the “Condition” section, choose the “Dynamic” option, then set “Simple Moving Average” as the condition target. Select Greater and Equal as the operator to establish the “Short SMA ≥ Long SMA” condition.
In the “Increase/Decrease Target by” input field, enter “-1.5”.
The purpose of this step is to check the values of the previous period, which means, we need to set the “Target Time Offset” to “1-day”.
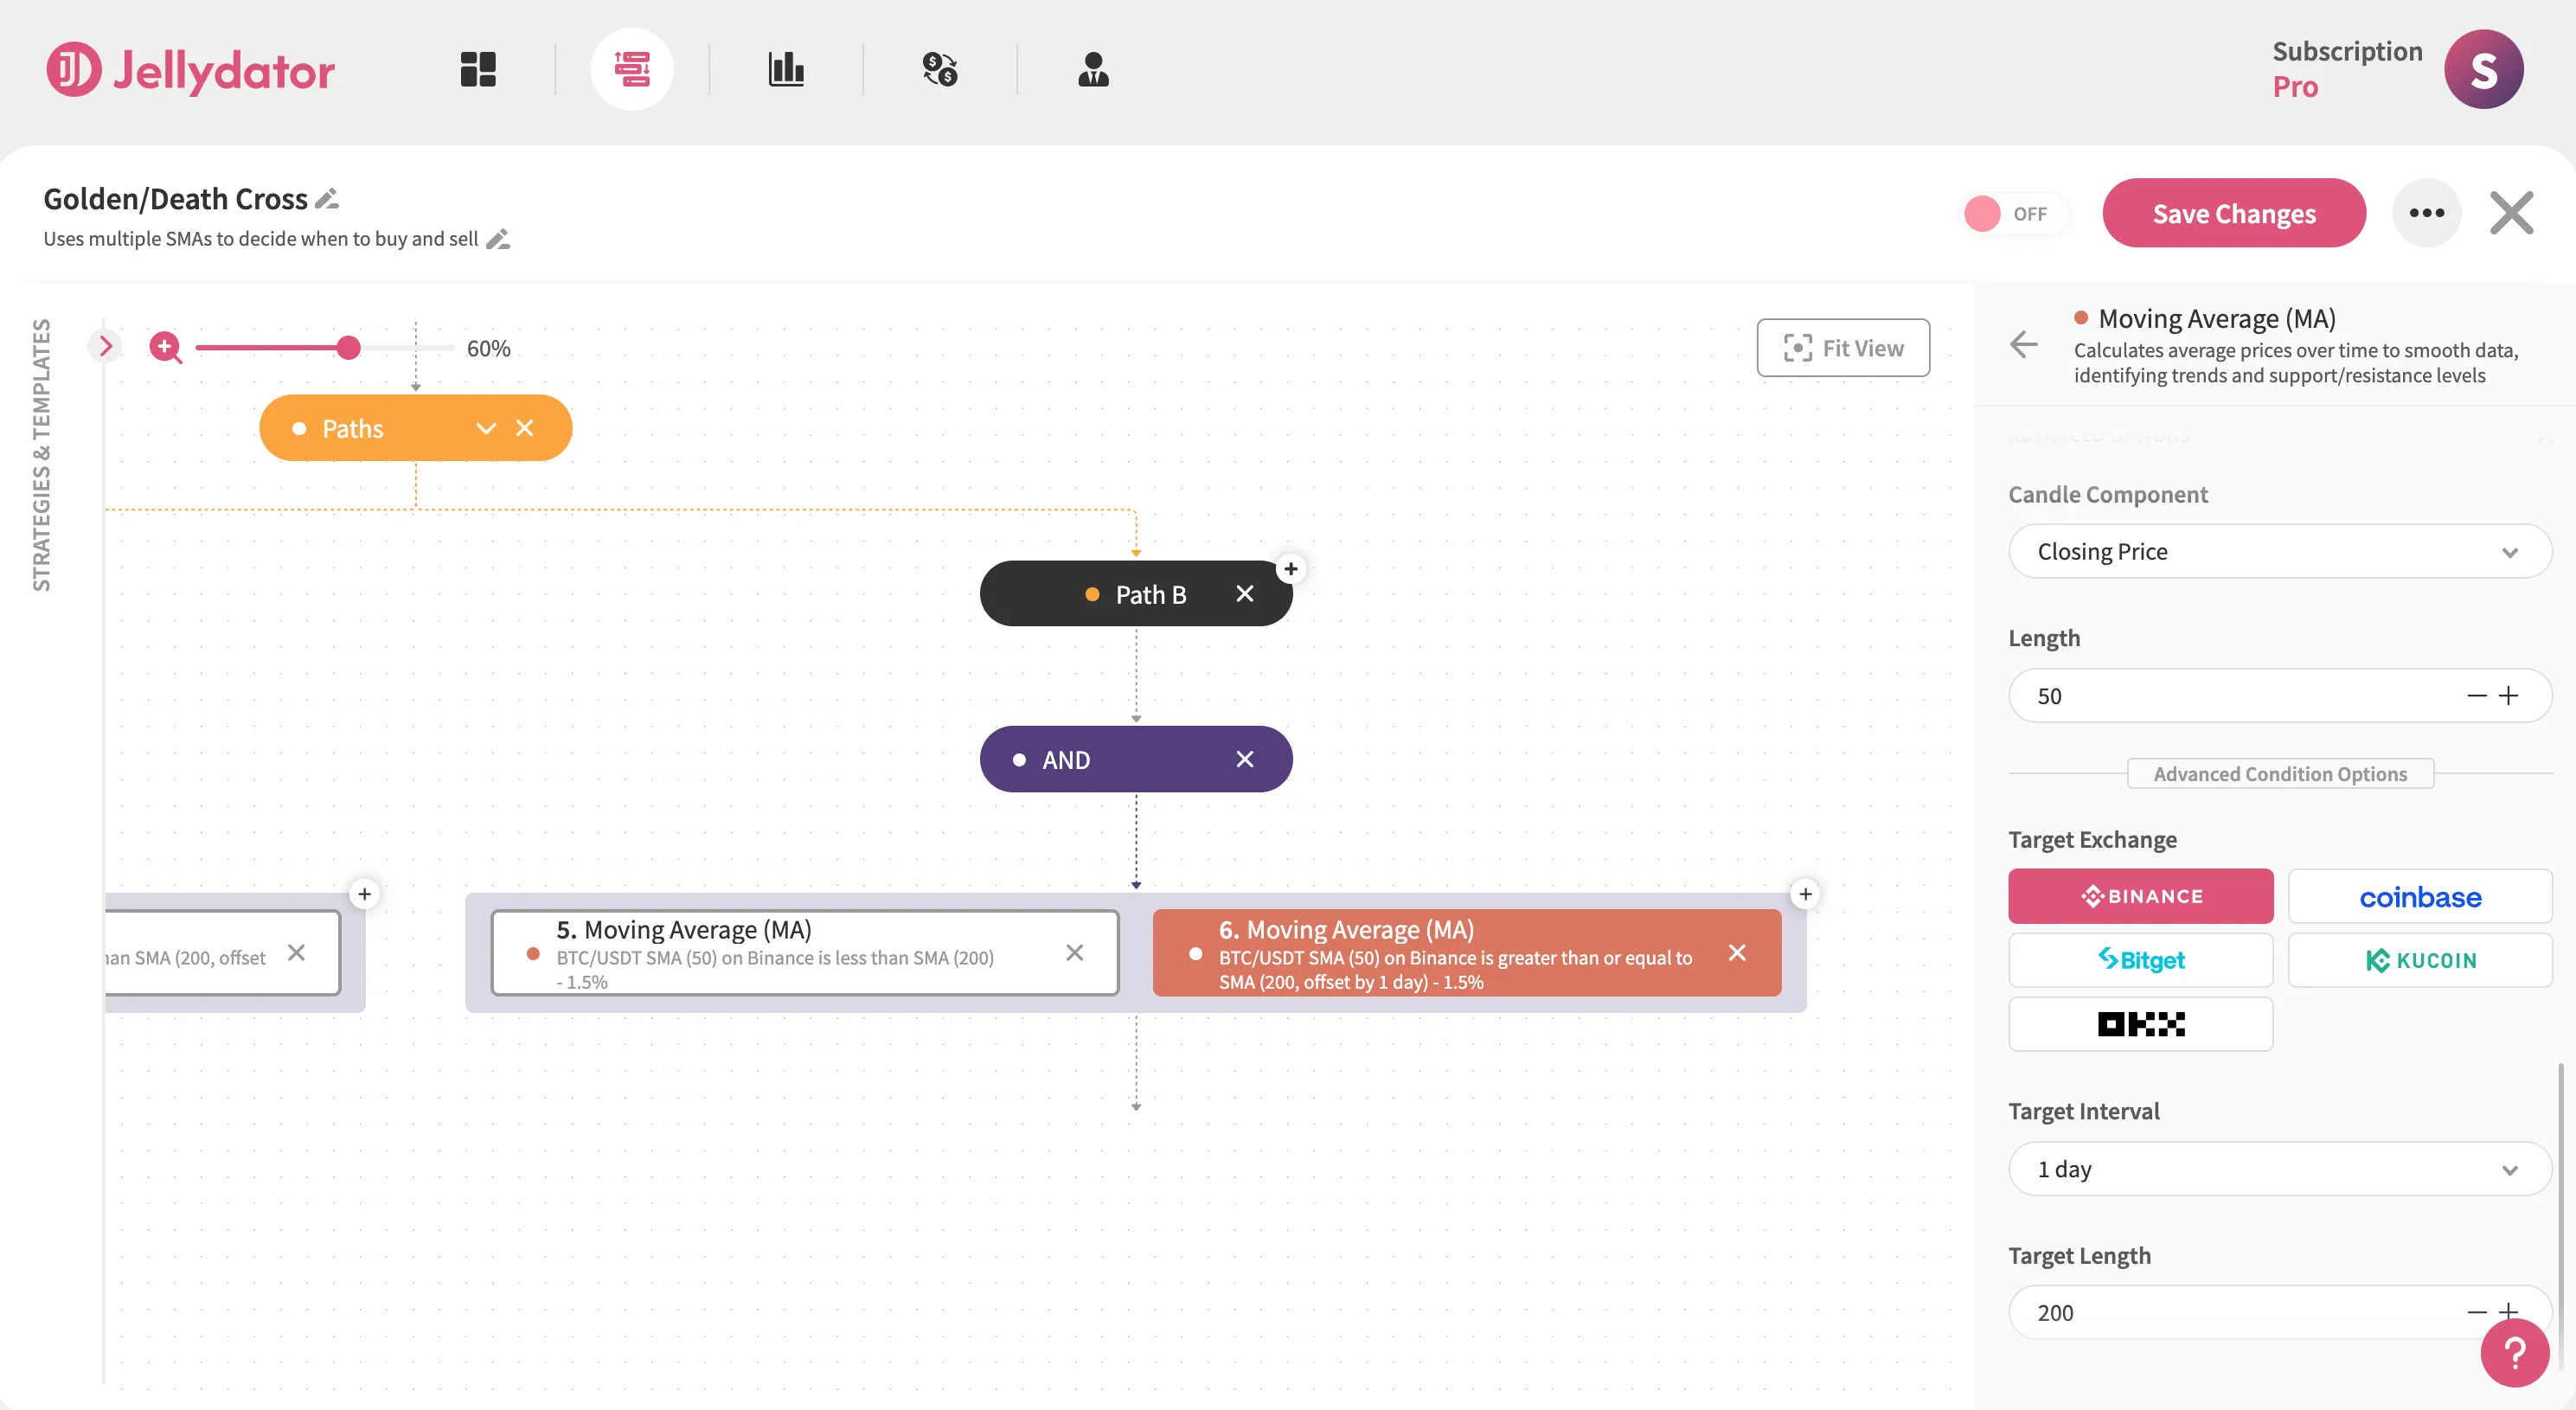
Just like with the first Moving Average of Path B, click on the “Advanced Options” button, then set the “Length” to 50 (the length of the short SMA) and the condition “Target Length” condition to 200 (the length of the long SMA).
In Path A, we added a Date & Time step to ensure that only one buy order is executed per day. It only makes sense that we do the same in Path B:
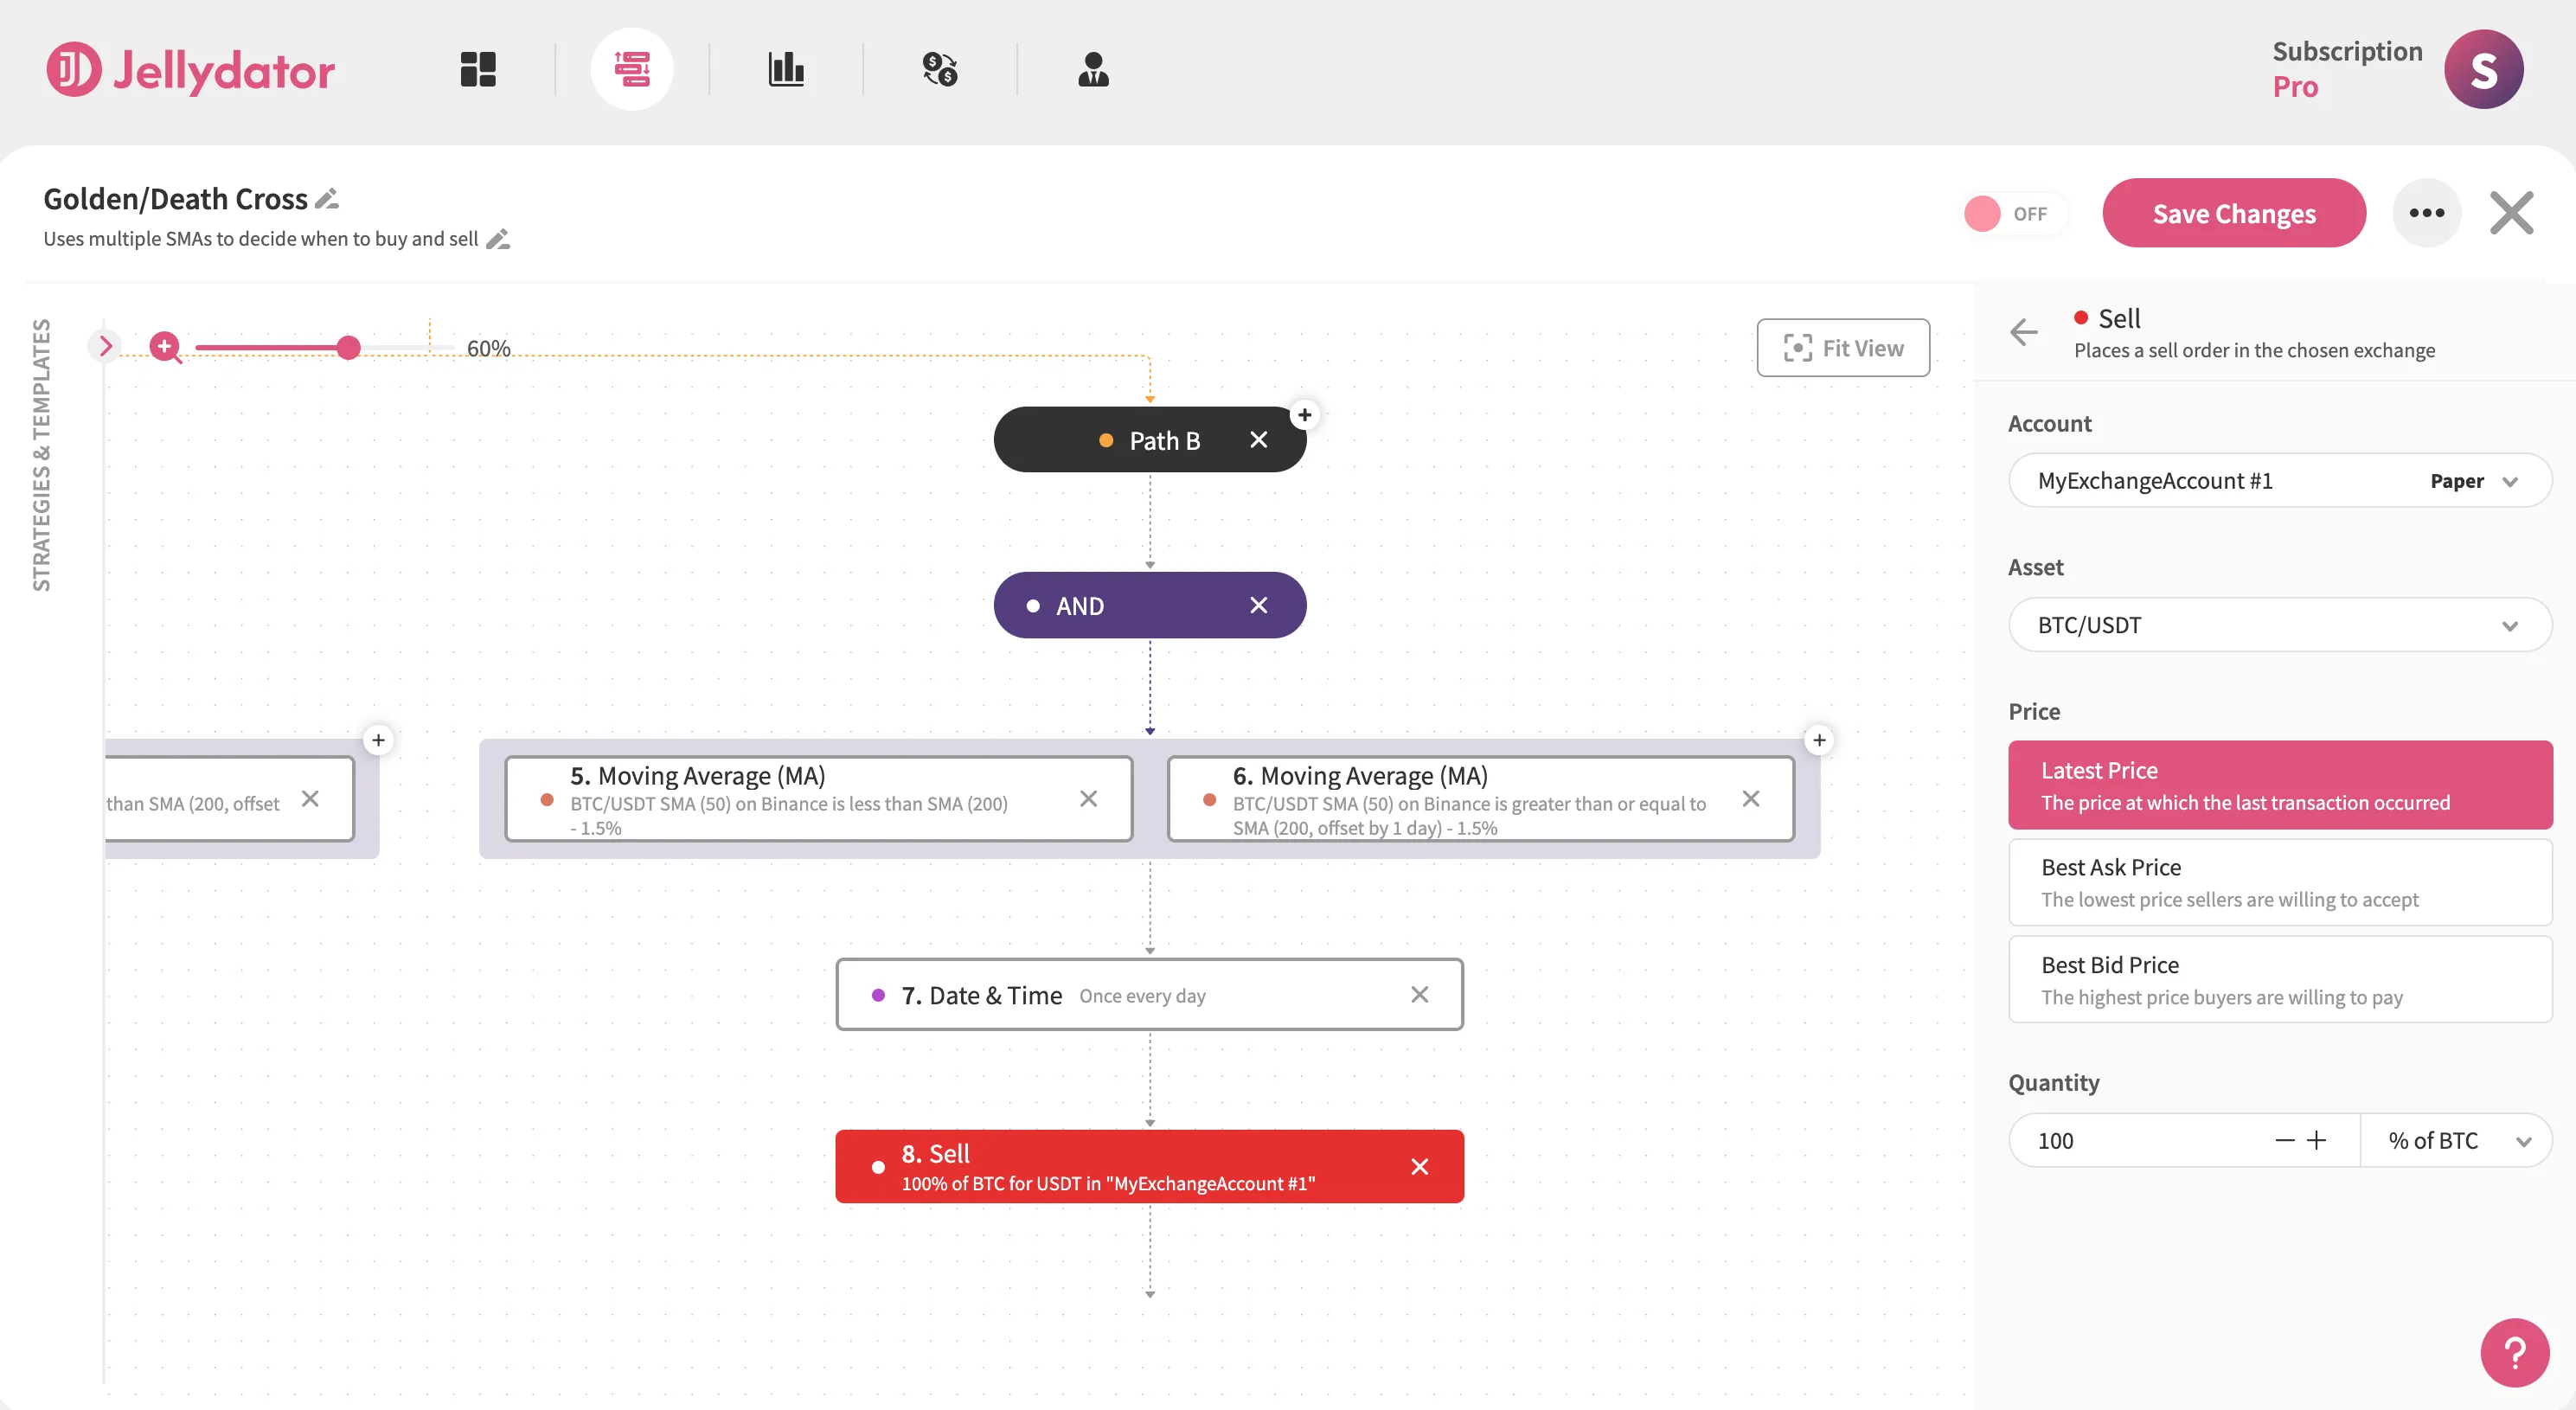
Below this step, place a Sell step. It should use the same asset pair and price option as the Buy step. Set the quantity value to 100% of your BTC.
Additional Enhancements
Block Overlapping Orders
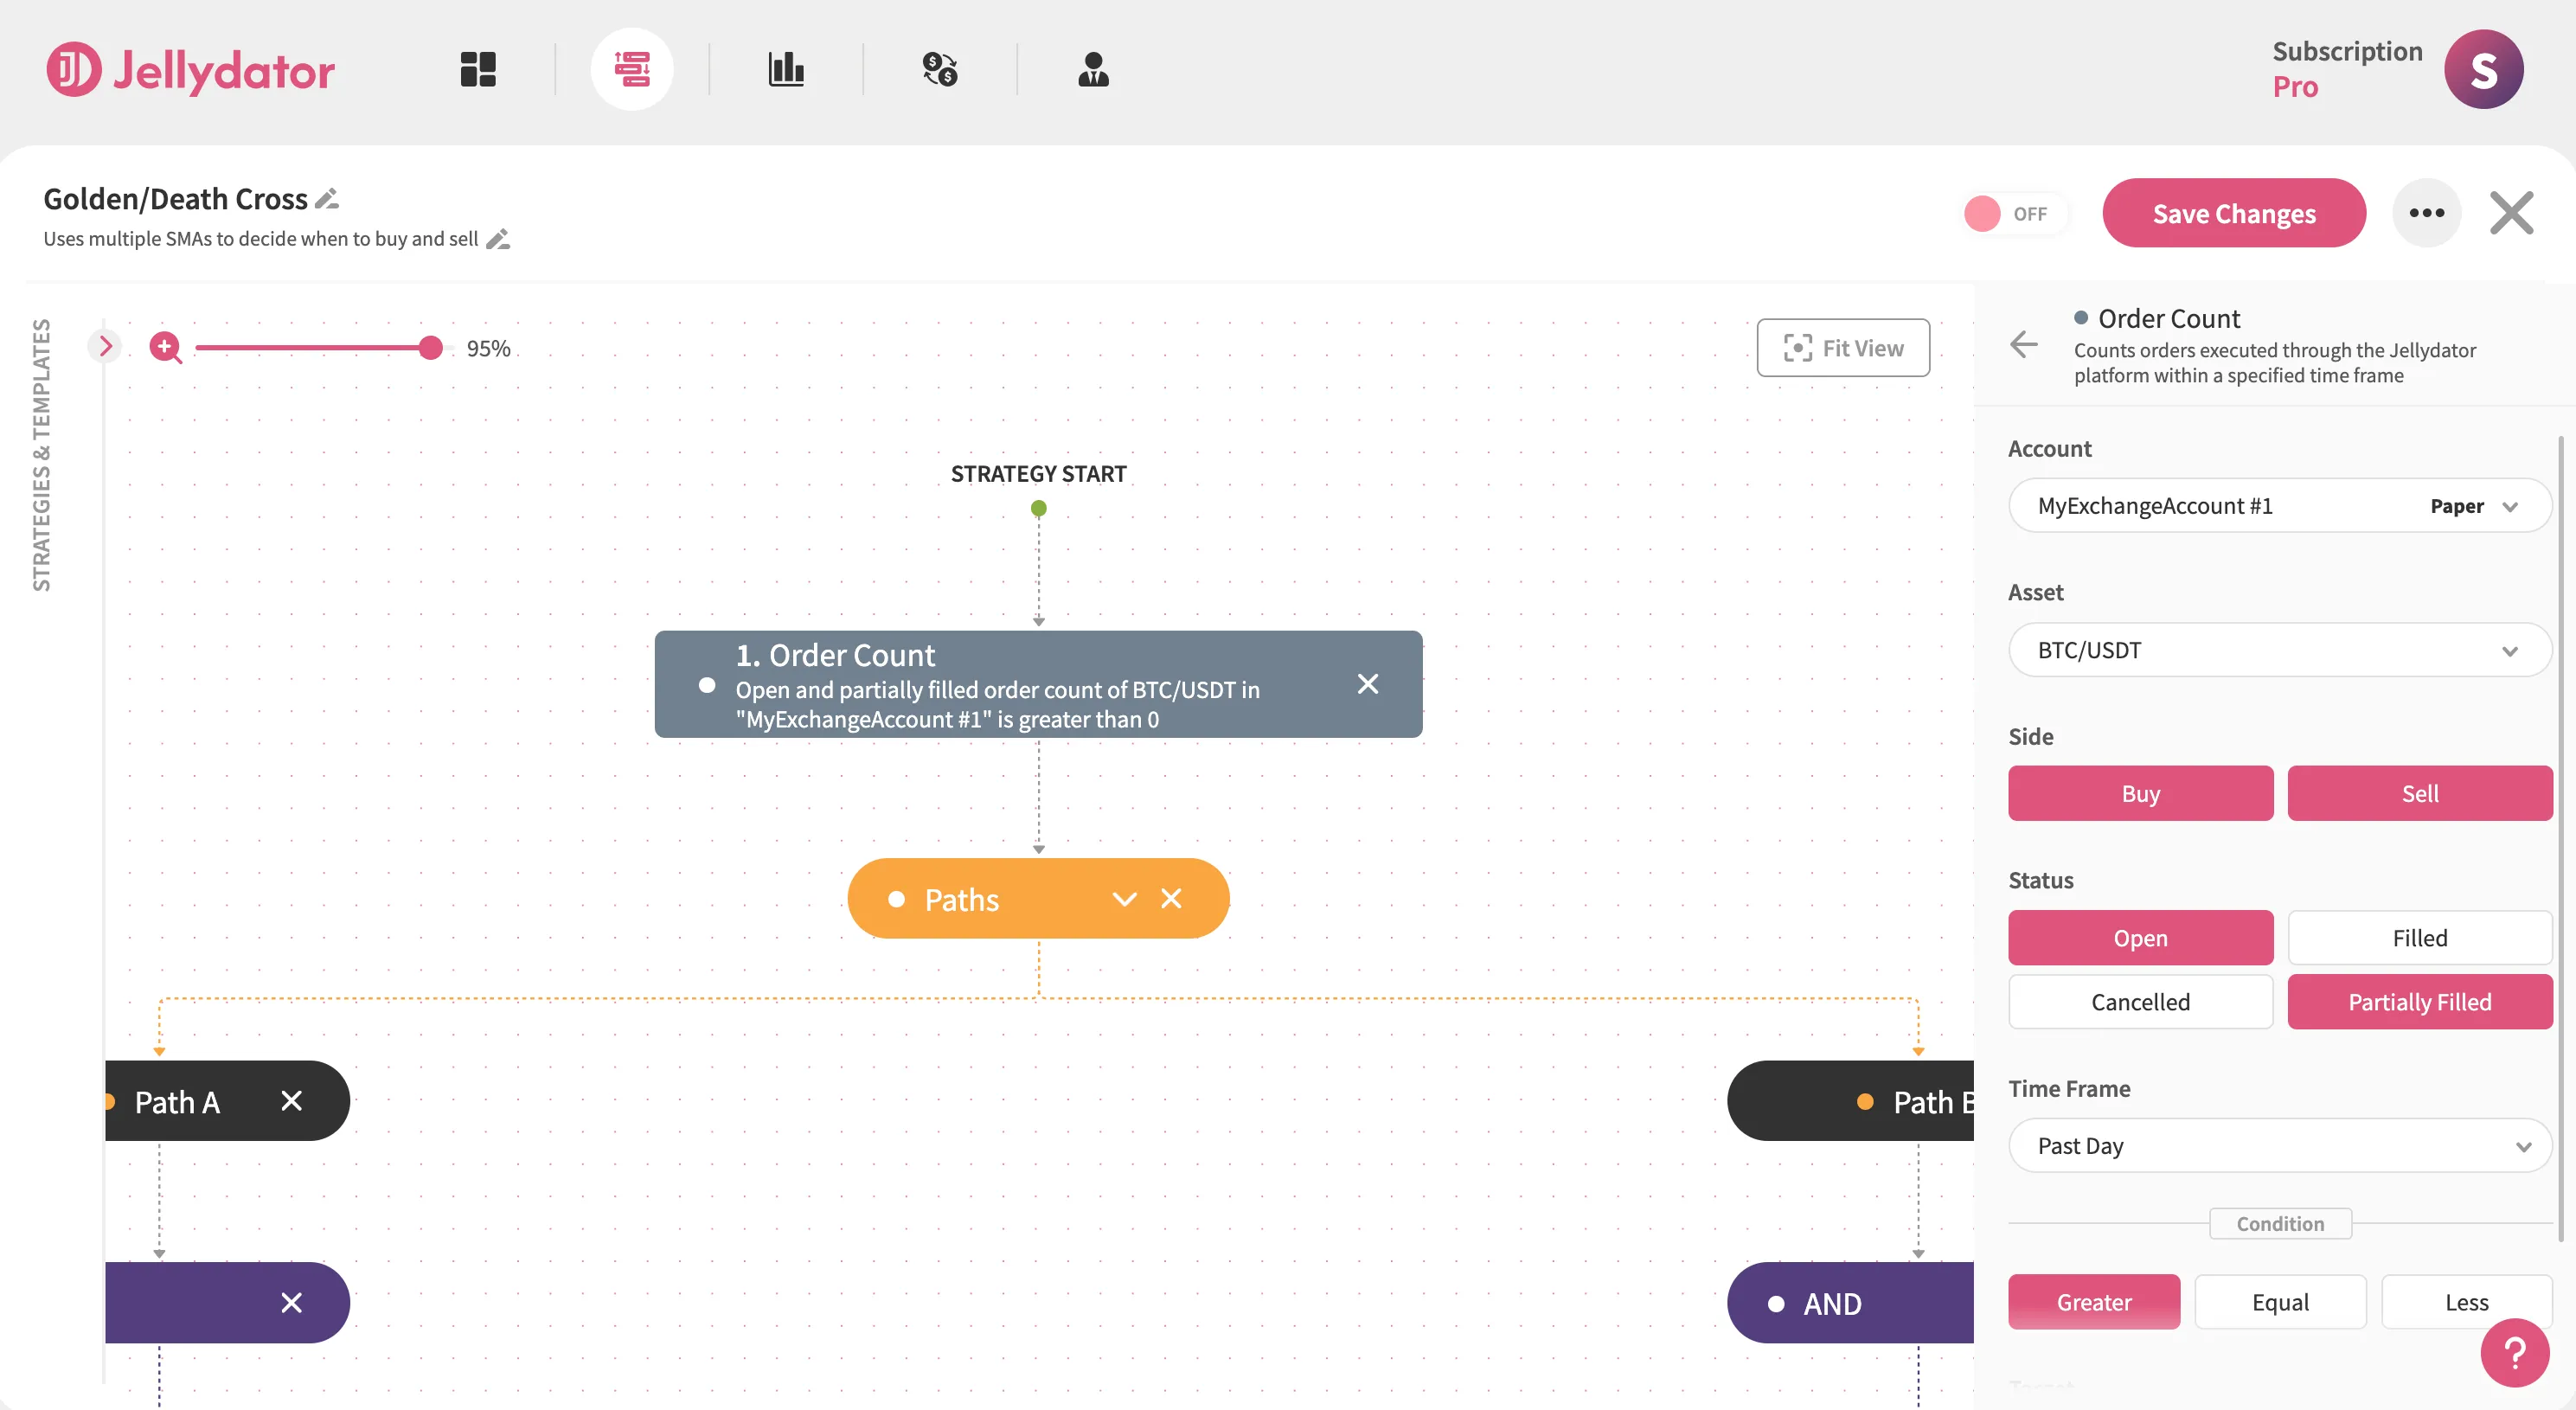
Add an Order Count step before your Paths to prevent duplicate trades. Configure it to check BTC/USDT orders with both buy and sell sides. Set status filters to “Open” and “Partially Filled.”
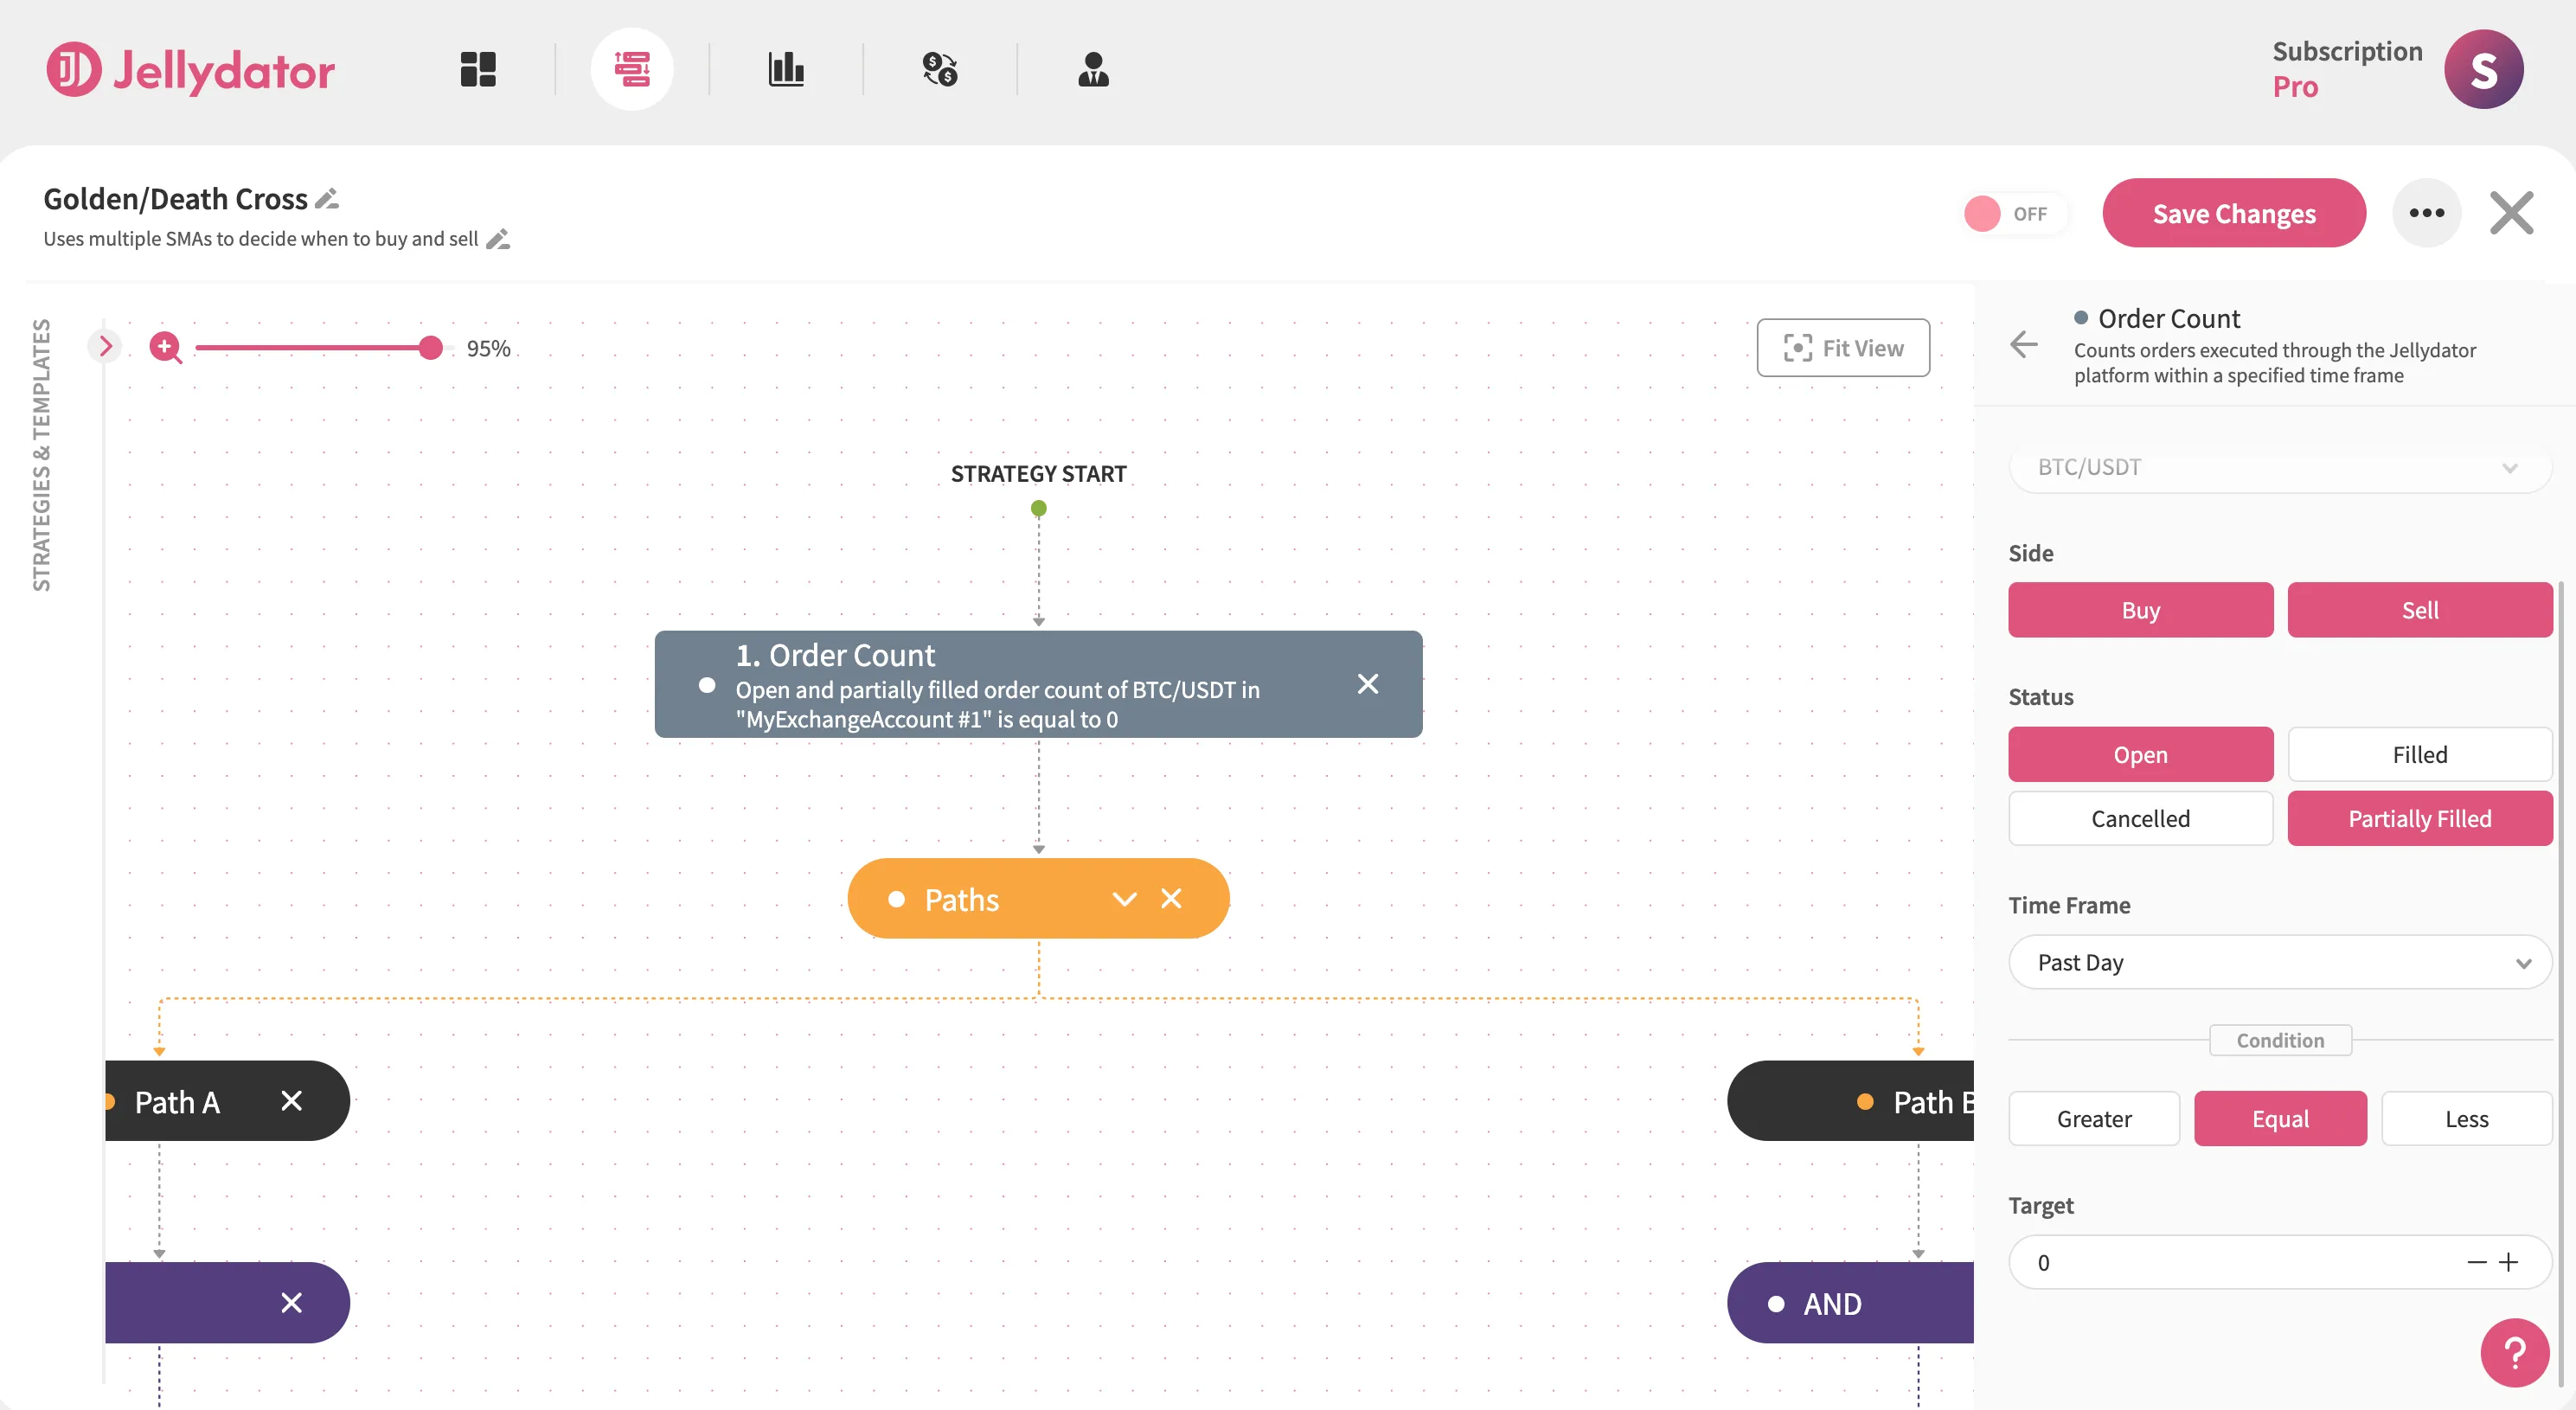
Then, create the condition “Equal to 0”. This crucial check ensures your strategy only acts when previous orders are fully completed, maintaining clean trade execution.
Add Balance Verification Steps
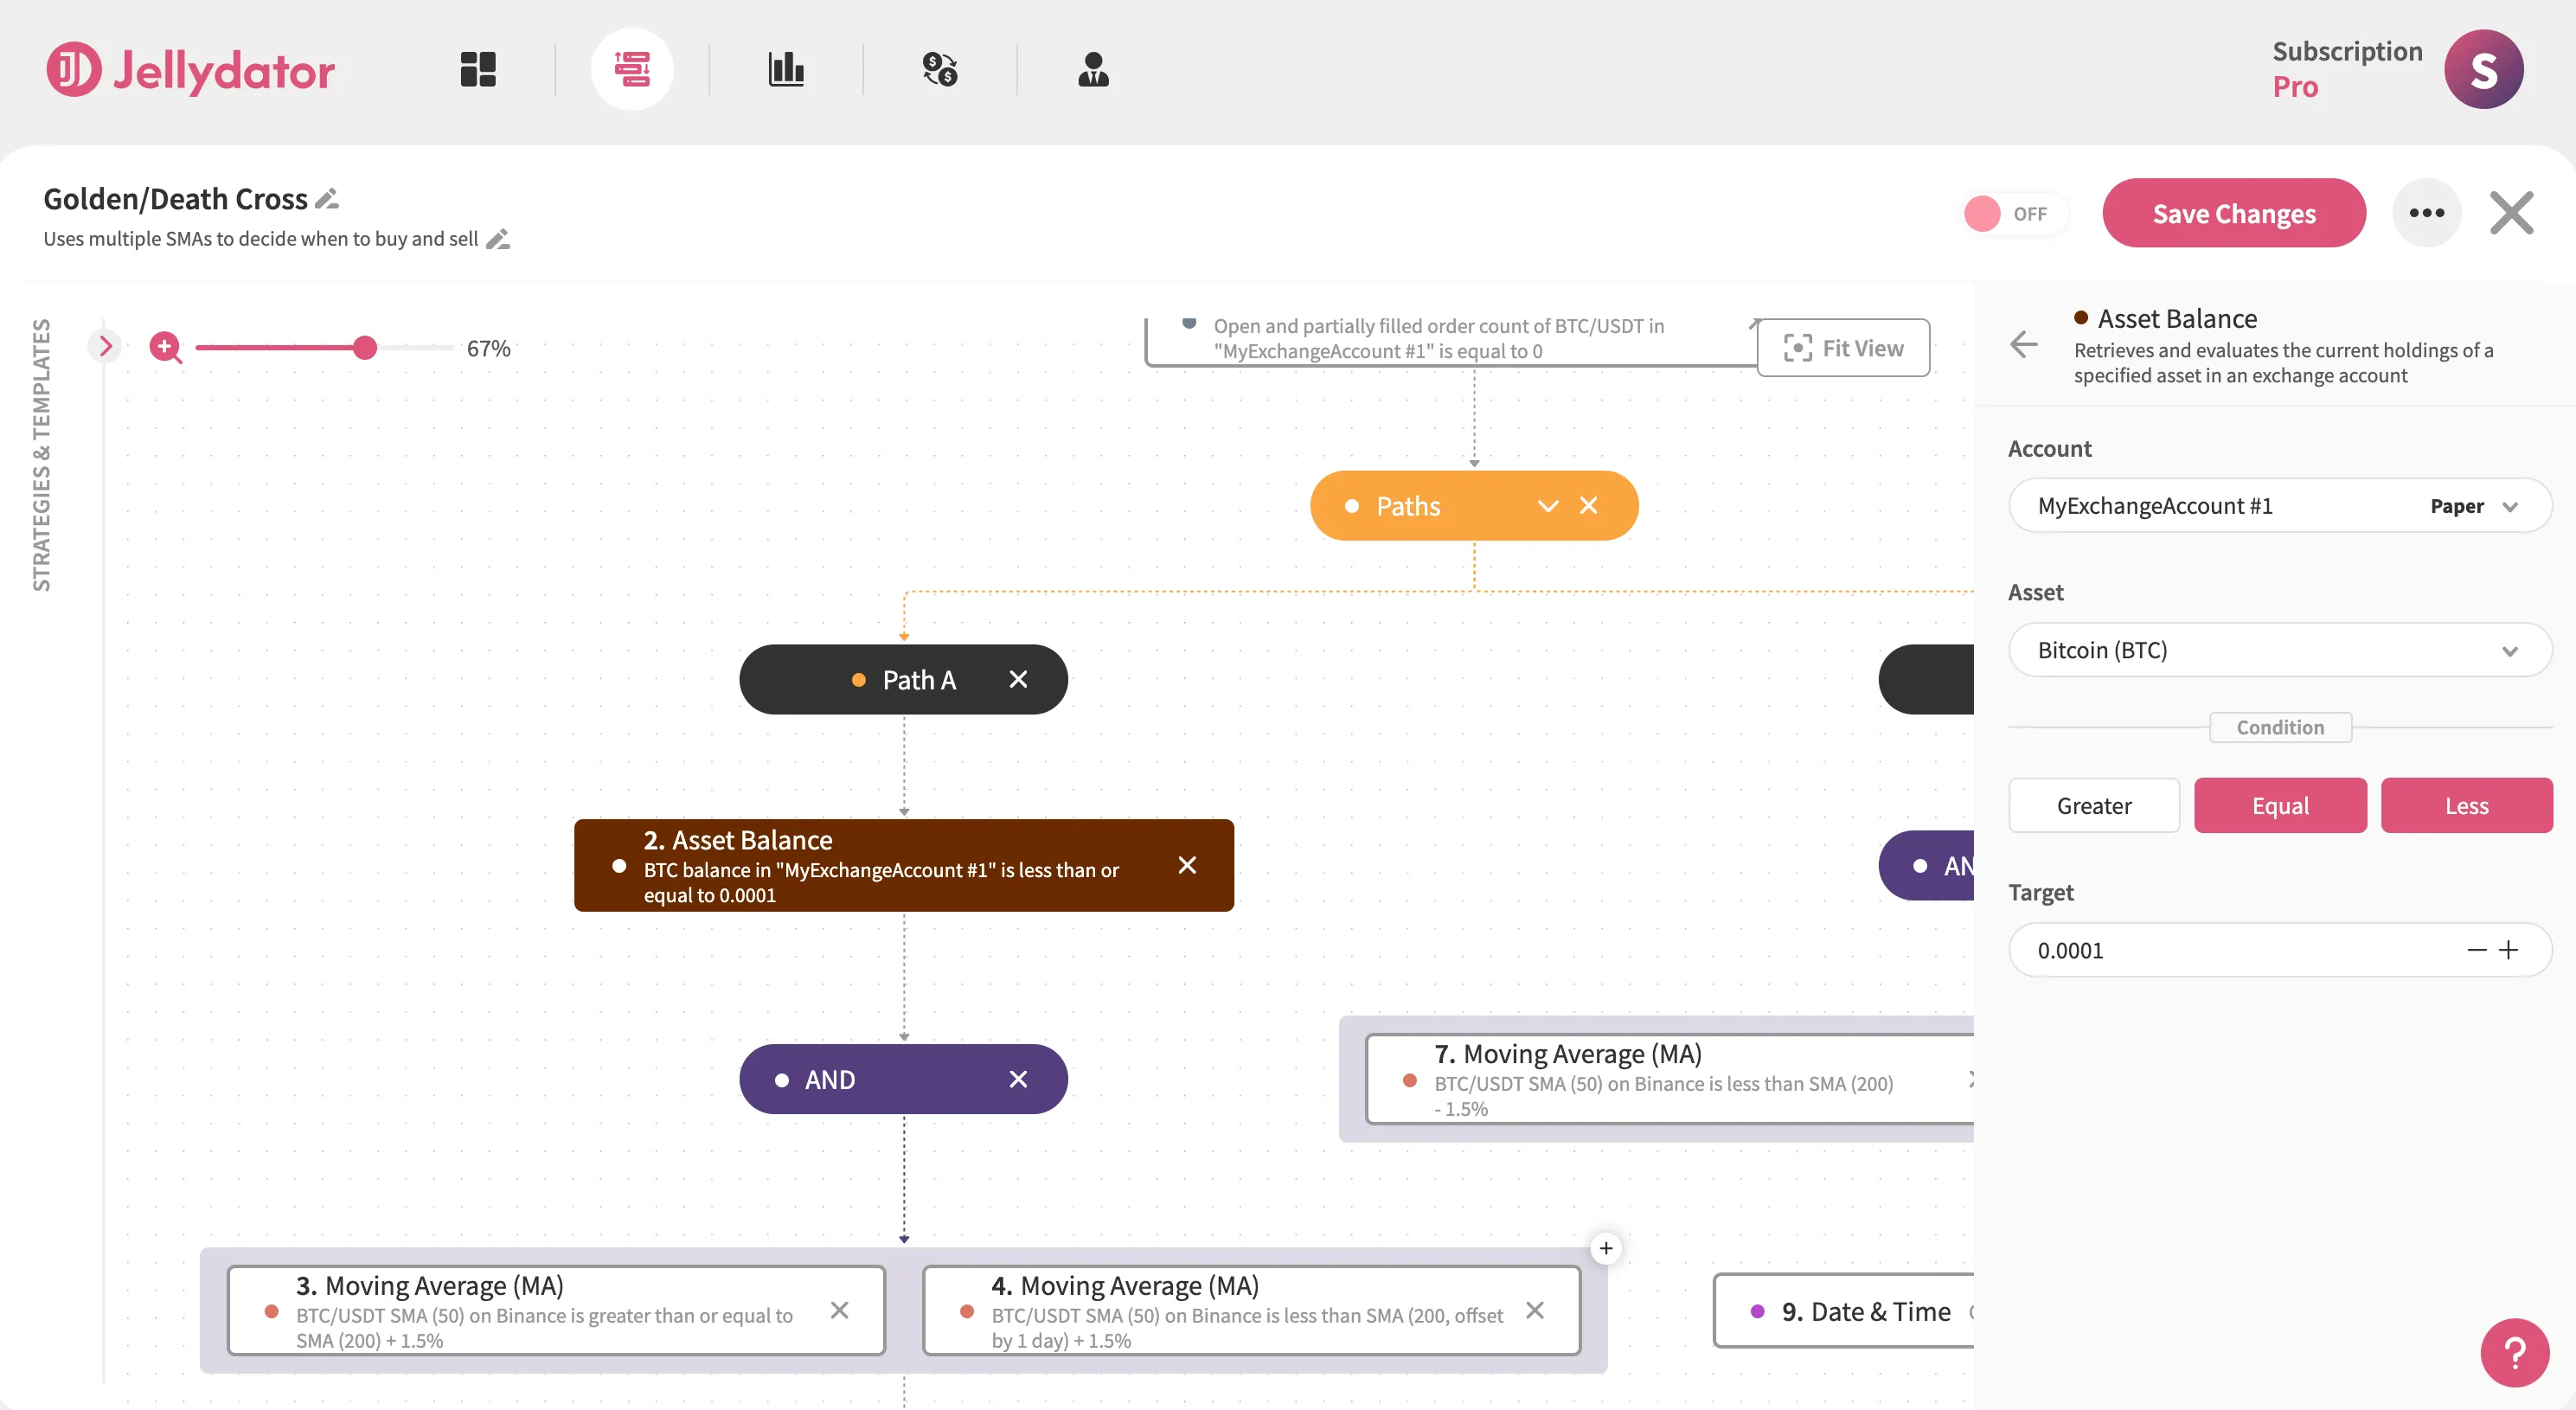
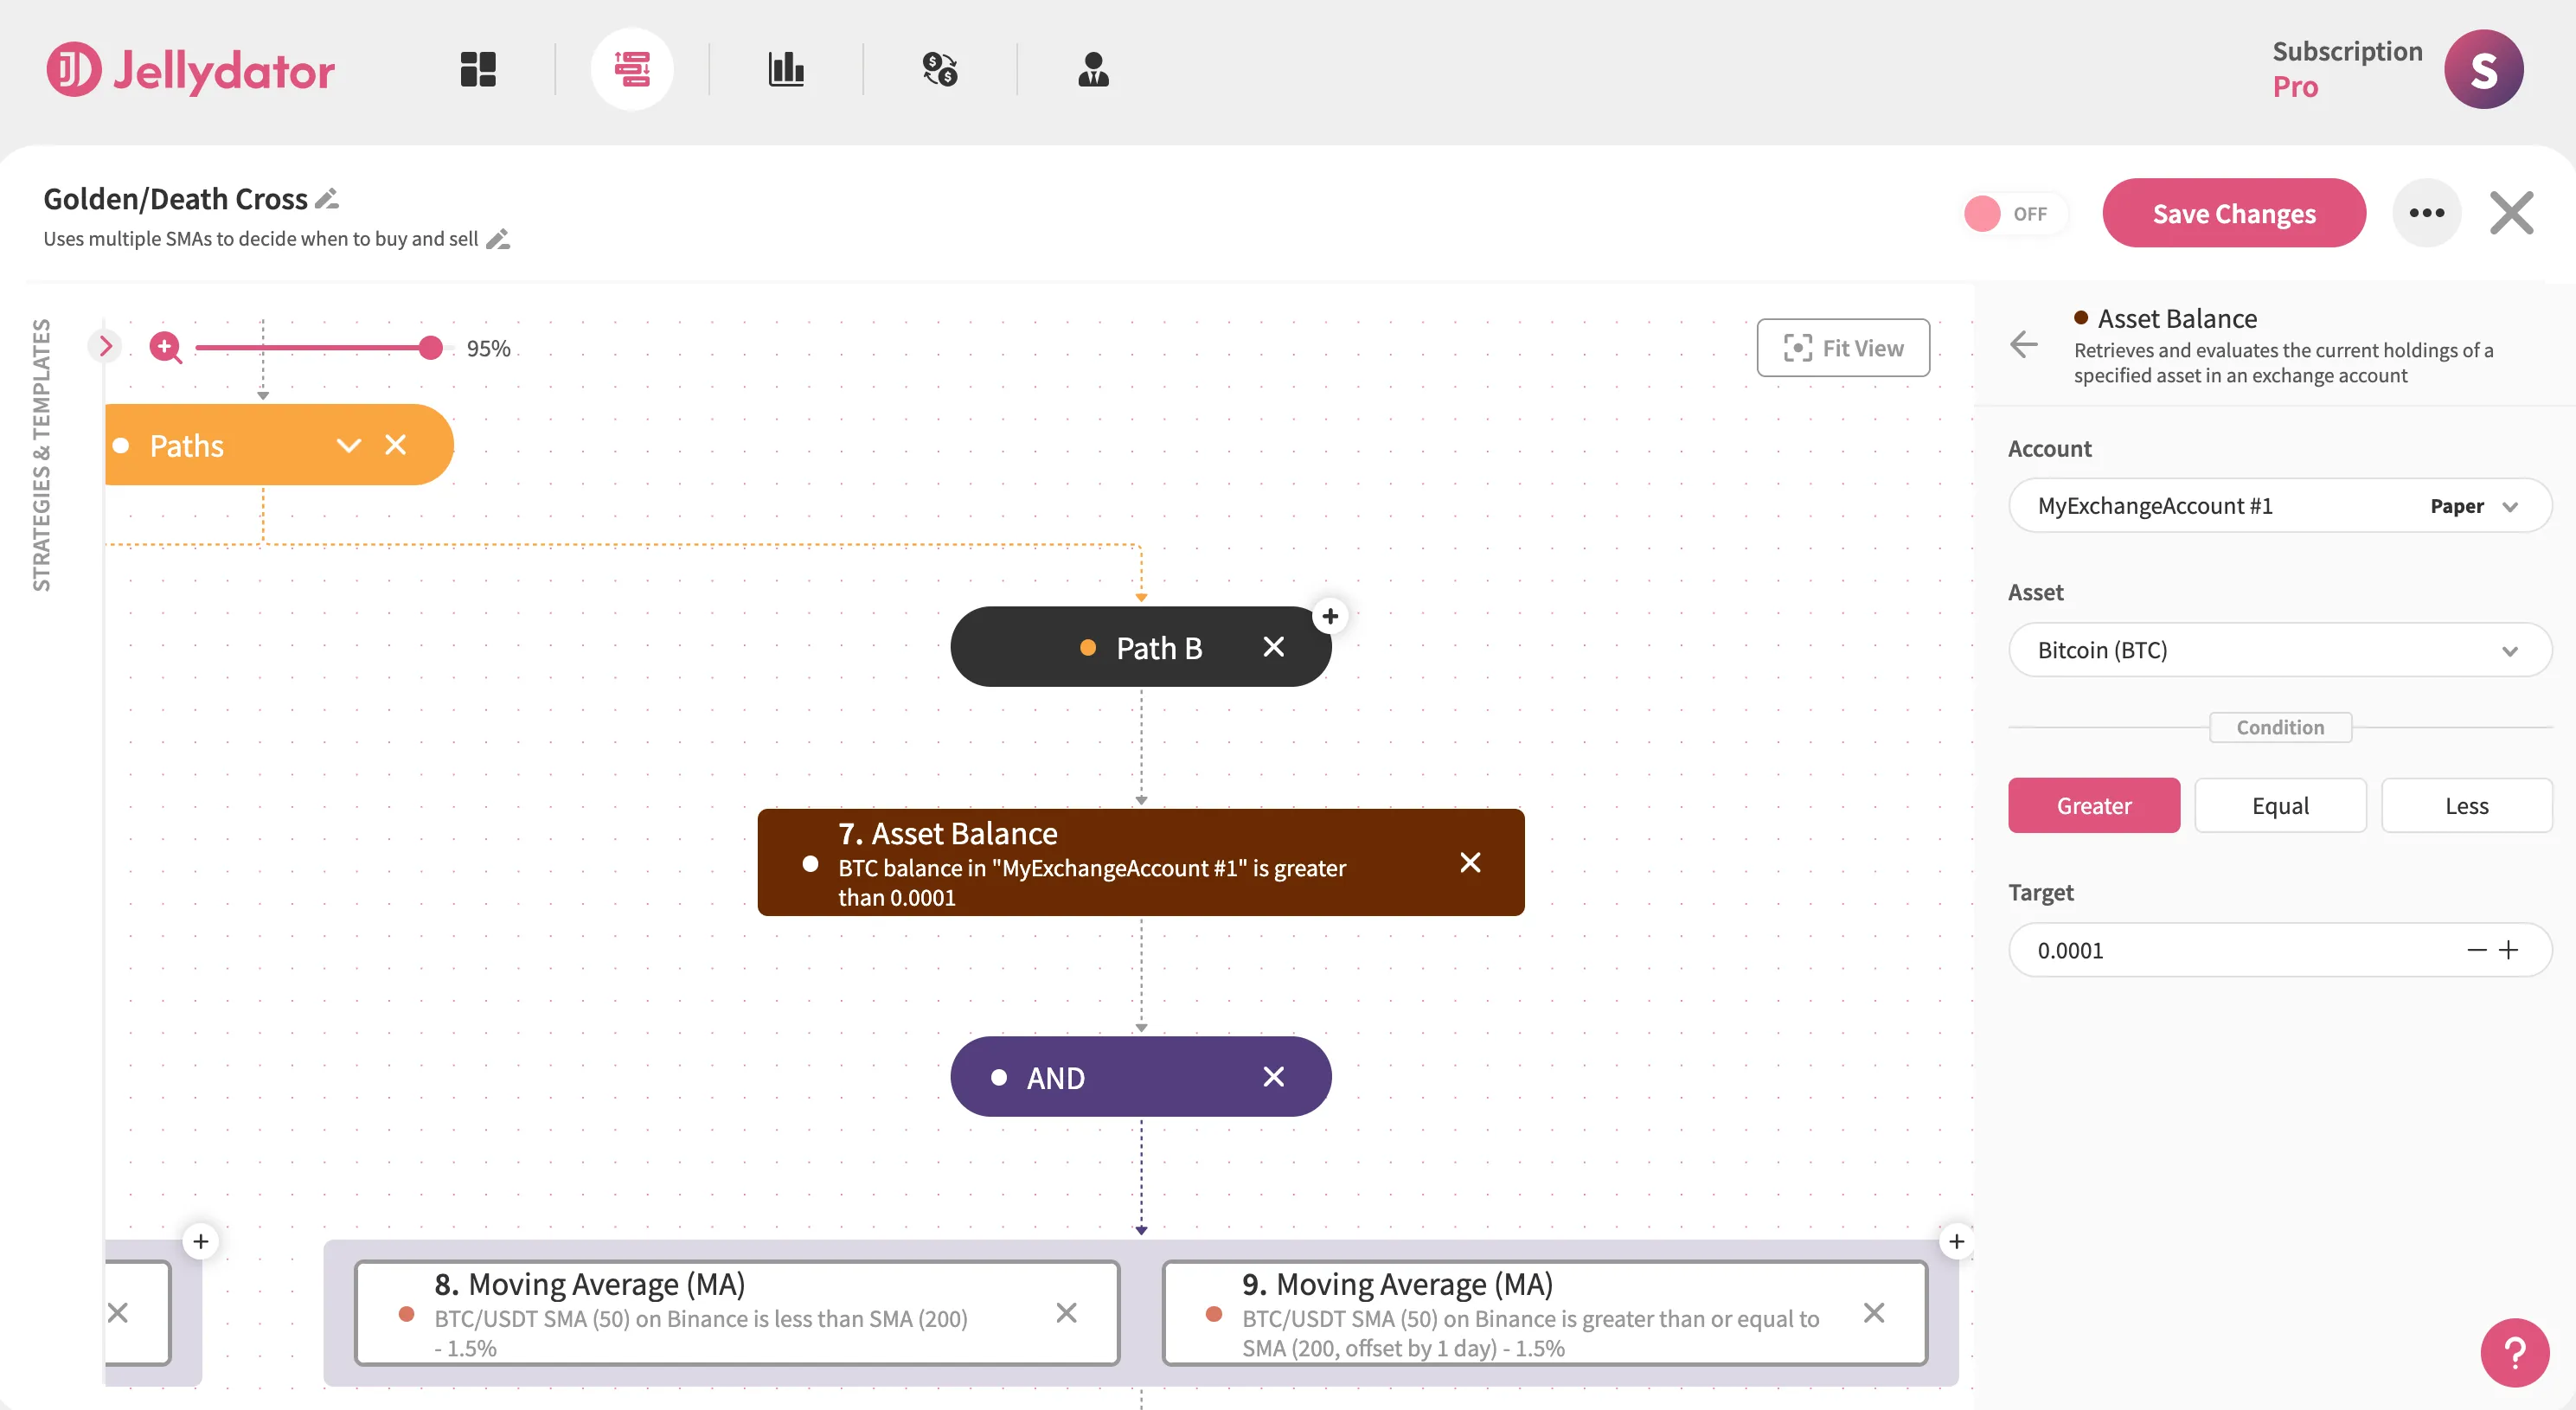
In Path A, add an Asset Balance step for BTC. Set the condition to “Less Than or Equal To” a small amount like 0.0001 BTC—this ignores residual “dust” while treating your balance as effectively empty for buying.
In Path B, add another Asset Balance step for BTC with “Greater Than” the same threshold. This ensures you only sell when holding a tradable quantity. Together, these steps maintain clean position management across both entry and exit points.
Stay Informed with Real-Time Alerts
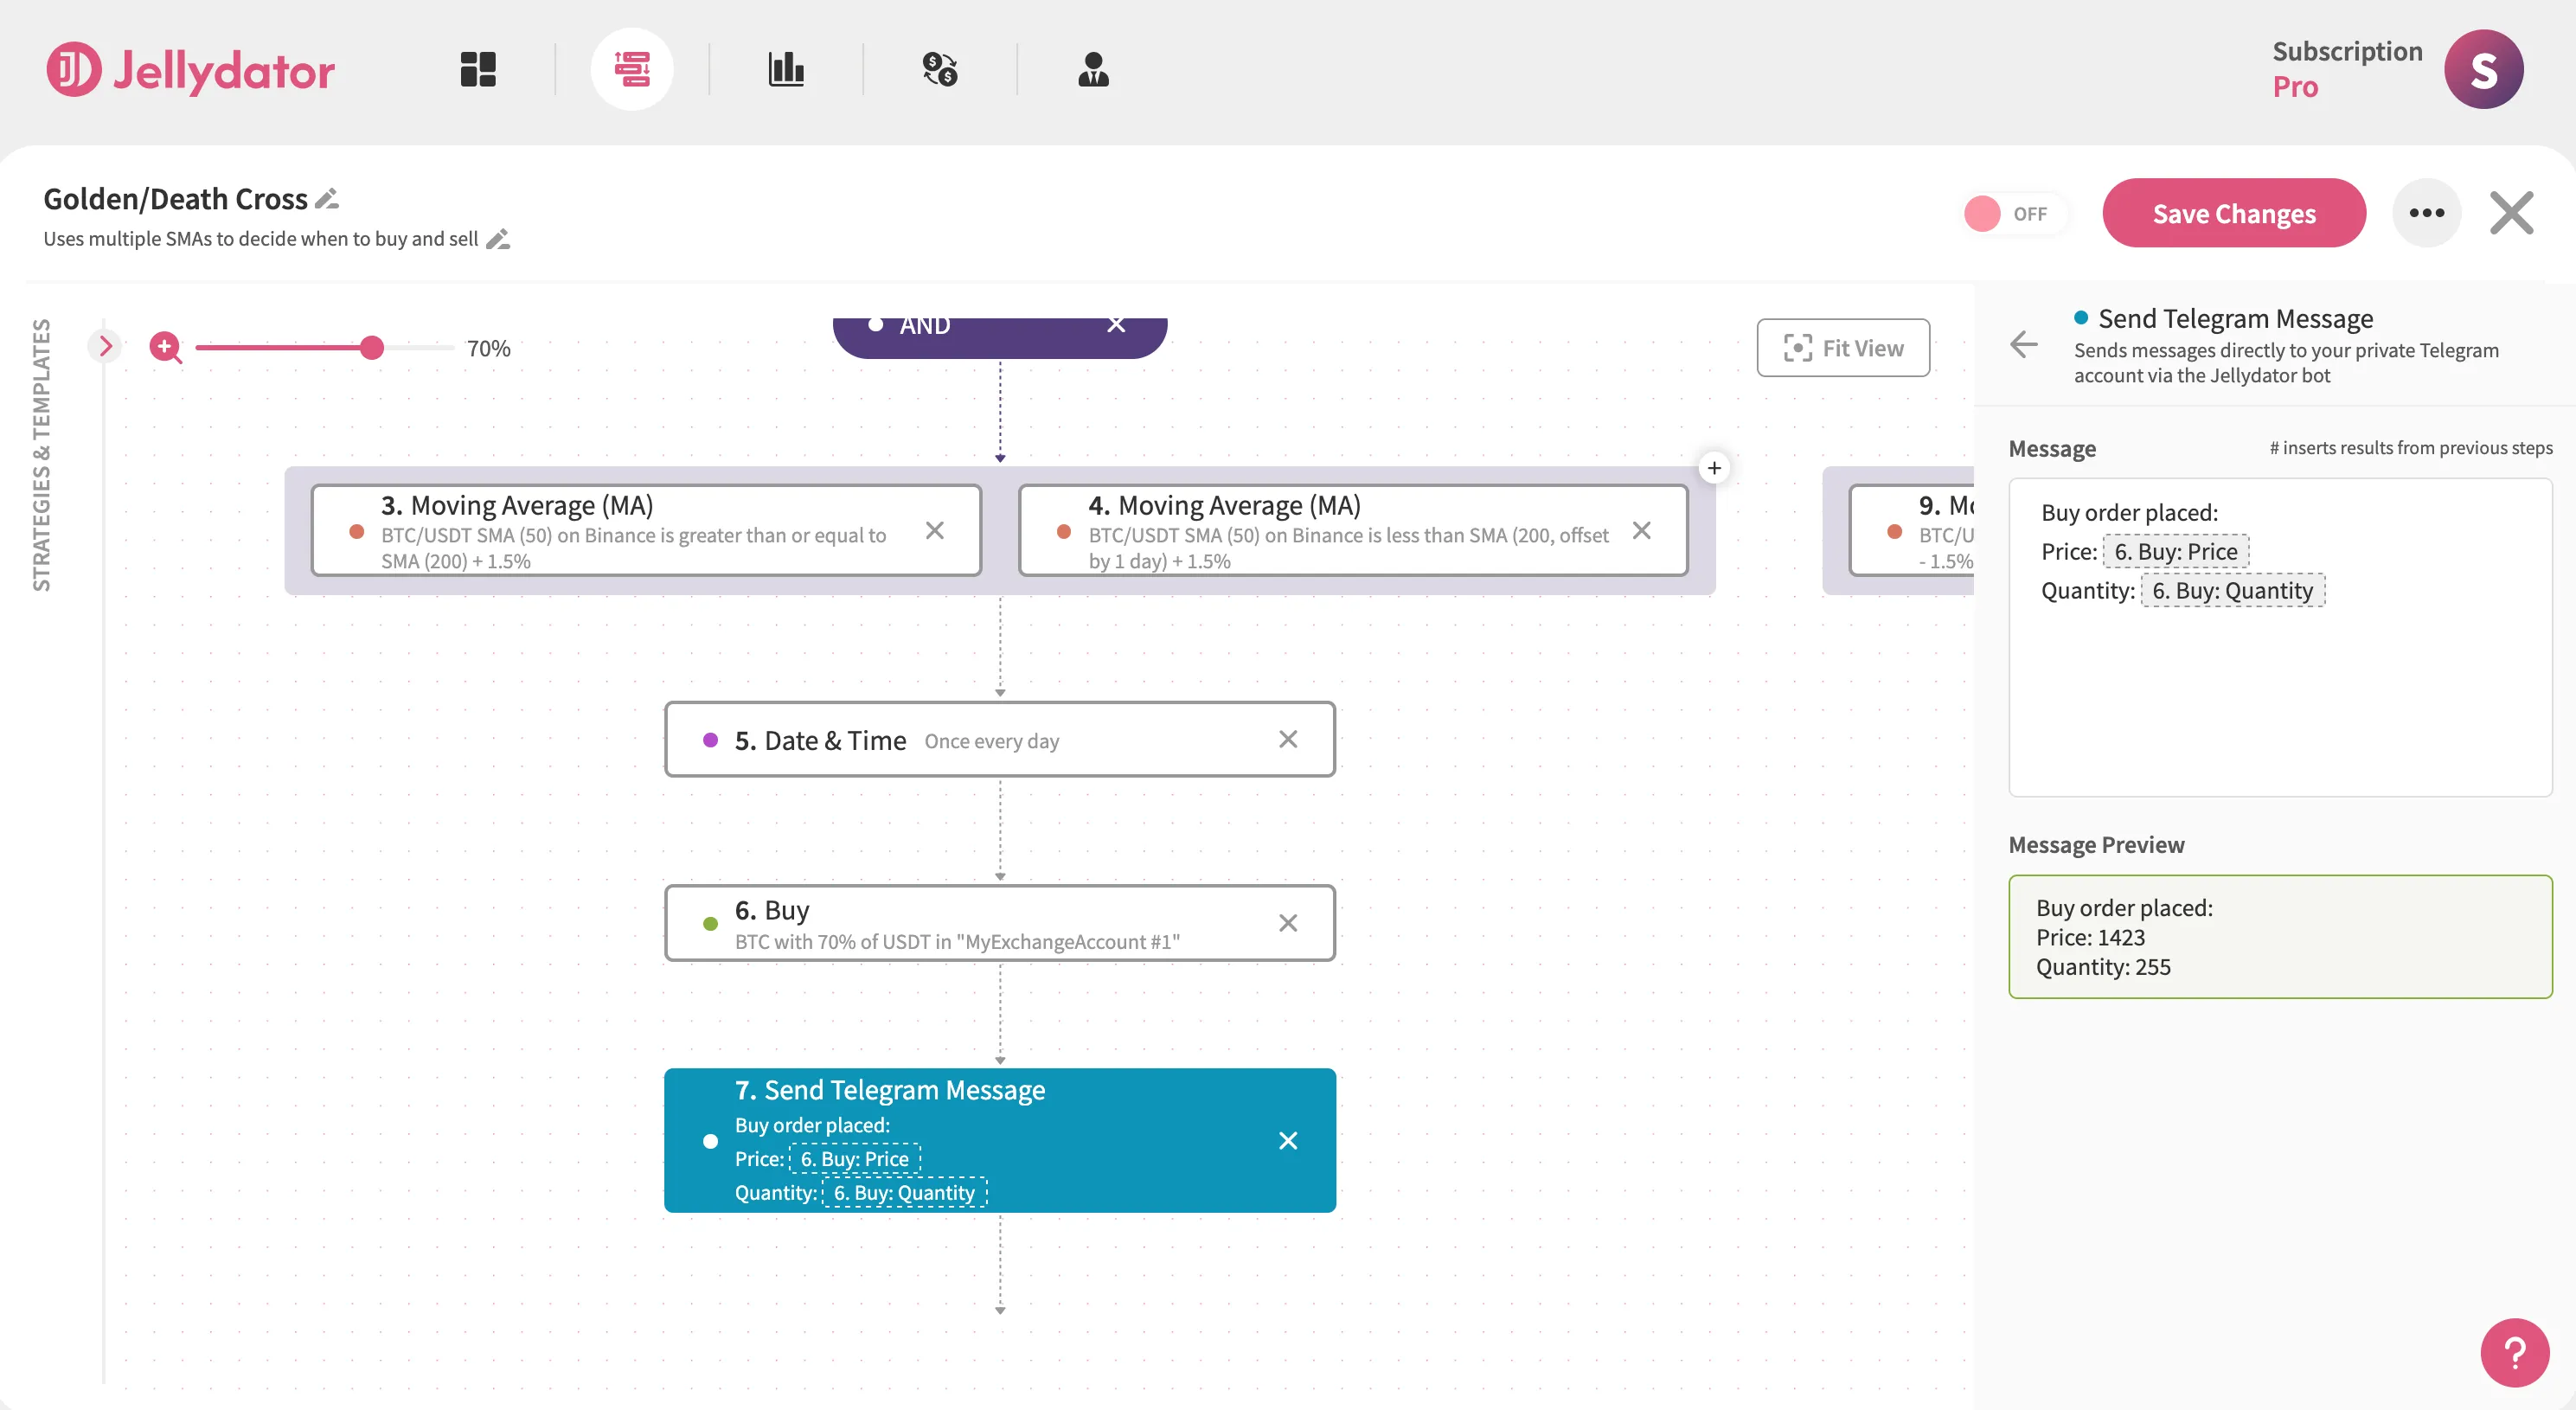
Enhance your strategy by adding Telegram notifications to both paths. In Path A, include a Send Telegram Message step after your buy order. Customize it with a clear buy message like “Buy order placed.”
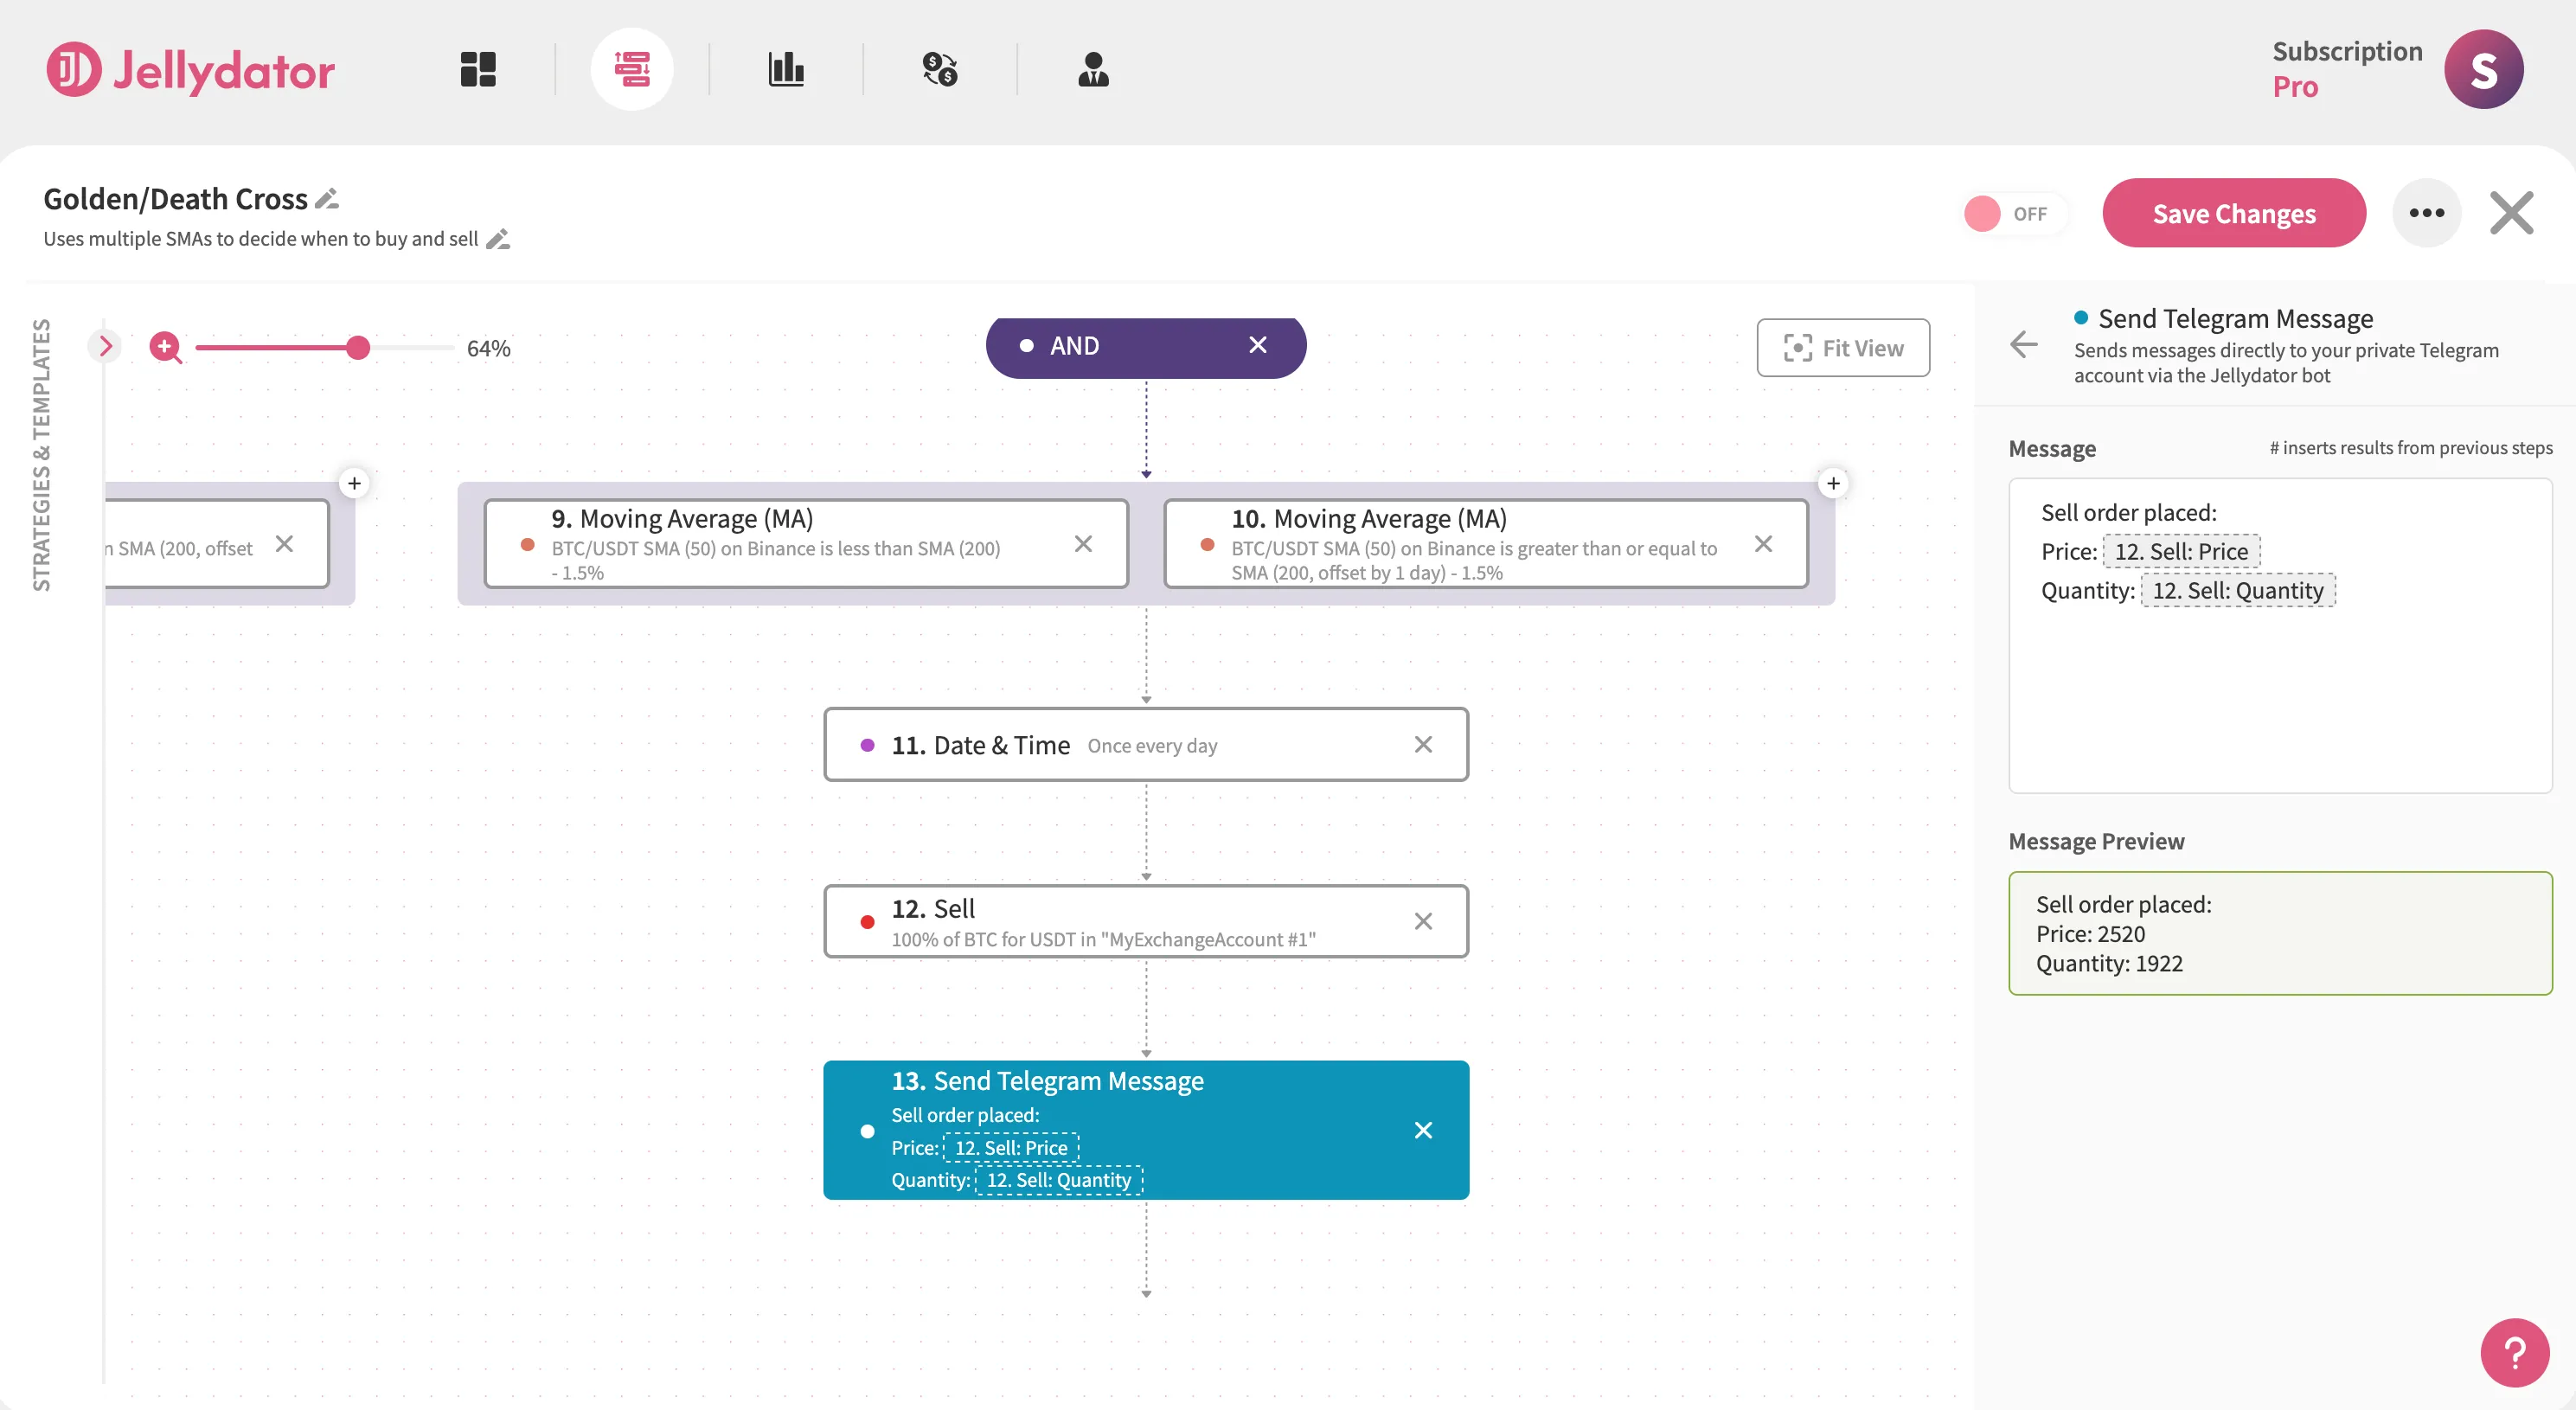
For Path B, place a similar message step after selling, using a phrase such as “Sell order placed.”
Conclusion
The Golden Cross and Death Cross can serve as useful signals when you set them up properly. Still, even the best strategies become more dependable when you confirm these signals with other indicators, like RSI, or by checking for strong trading volume. Keep in mind that both the Death Cross and the Golden Cross can sometimes show up late. For example, the Death Cross may appear after most of a decline has already happened, while the Golden Cross can show up after an uptrend is already in progress. Markets might even reverse soon after these signals. That’s why adding extra data — like Google search trends or institutional money flows — can give your strategy a broader perspective and help you spot signals that regular price charts might miss.