
Everyone knows that the most profitable trades are often the ones that most people miss. But knowing this and actually putting it into practice are two different things. Just because you go against the shared thinking of the majority doesn’t mean you are immediately more likely to succeed. In fact, this usually leads to extensive losses of capital and confidence.
So, is “going against the crowd” just an empty saying, meant to lure in traders who don’t really understand how markets work? Not always, especially if you have the right tools at your disposal.
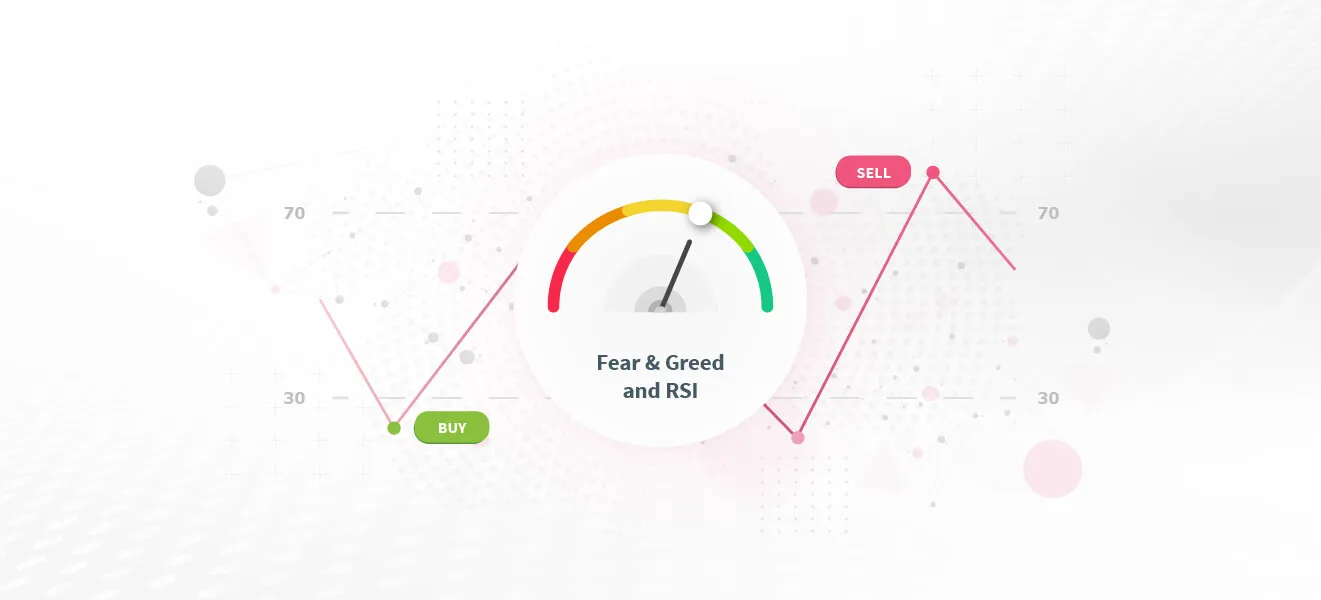
Contrarian trading is a popular approach among many traders. The whole idea is to do the opposite of what the majority is doing, but it’s not just about gut feeling or emotion. It’s based on logic and data. To make sense of all the numbers and trends, traders use market analysis tools that boil down complex information into simple, clear indicators.
One great example is the Crypto Fear & Greed Index. This indicator pulls together data from several sources, including:
- Volatility trends, compared to the last 30 and 90 days.
- Changes in trading volume and market momentum.
- Social media activity, especially how quickly and how often people interact with Bitcoin topics.
- The dominance of Bitcoin versus altcoins.
- Google search trends for Bitcoin-related keywords.
All this data is combined into a single number ranging from 0 to 100, usually shown on a gauge chart:
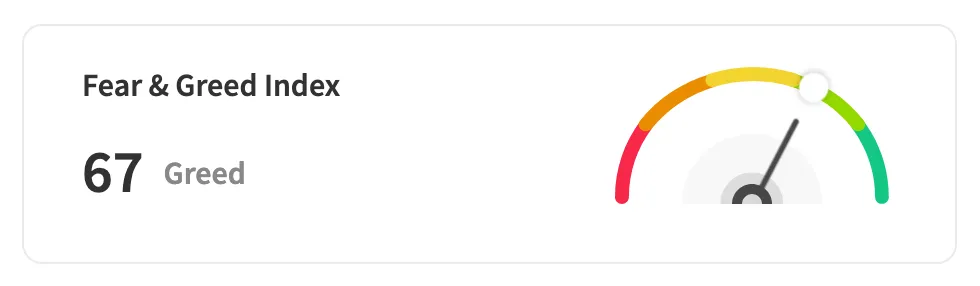
The higher the number, the greedier the market is considered. To make it easier to read, the index is split into five groups:
- 0–20: Extreme fear
- 20–40: Fear
- 40–60: Neutral
- 60–80: Greed
- 80–100: Extreme greed
Sometimes, it’s simplified even more, skipping the “neutral” group:
- 0–25: Extreme fear
- 25–50: Fear
- 50–75: Greed
- 75–100: Extreme greed
The Crypto Fear & Greed Index is a convenient tool that allows you to see the overall mood in the crypto market across different channels. However, it’s a bit too broad if you want to focus on just one or a few specific coins. To get a more precise view, you can pair it with the Relative Strength Index (RSI). The RSI measures how quickly and how much a price moves, also on a 0–100 scale, and highlights when an asset might be overbought or oversold.
With these two indicators as your special ingredients — each supporting the other and filtering out each other’s false positives — you have a recipe for a contrarian automated strategy.
How The Strategy Works
The main idea is that when the Crypto Fear & Greed Index drops into the extreme fear territory (usually below 25) and the RSI falls below 30 (signaling an oversold condition), the strategy flags a potential buy opportunity. The thinking here is straightforward: both indicators suggest the market may have bottomed out, and a reversal could be on the horizon. This kind of dual confirmation helps filter out false signals that might come from using just one indicator alone.
On the flip side, when the Fear & Greed Index climbs above 75 (extreme greed) and the RSI rises above 70 (overbought), the strategy sees this as a good time to sell and take profits. In this scenario, both indicators suggest that the market is likely overextended and at risk of a pullback or correction.
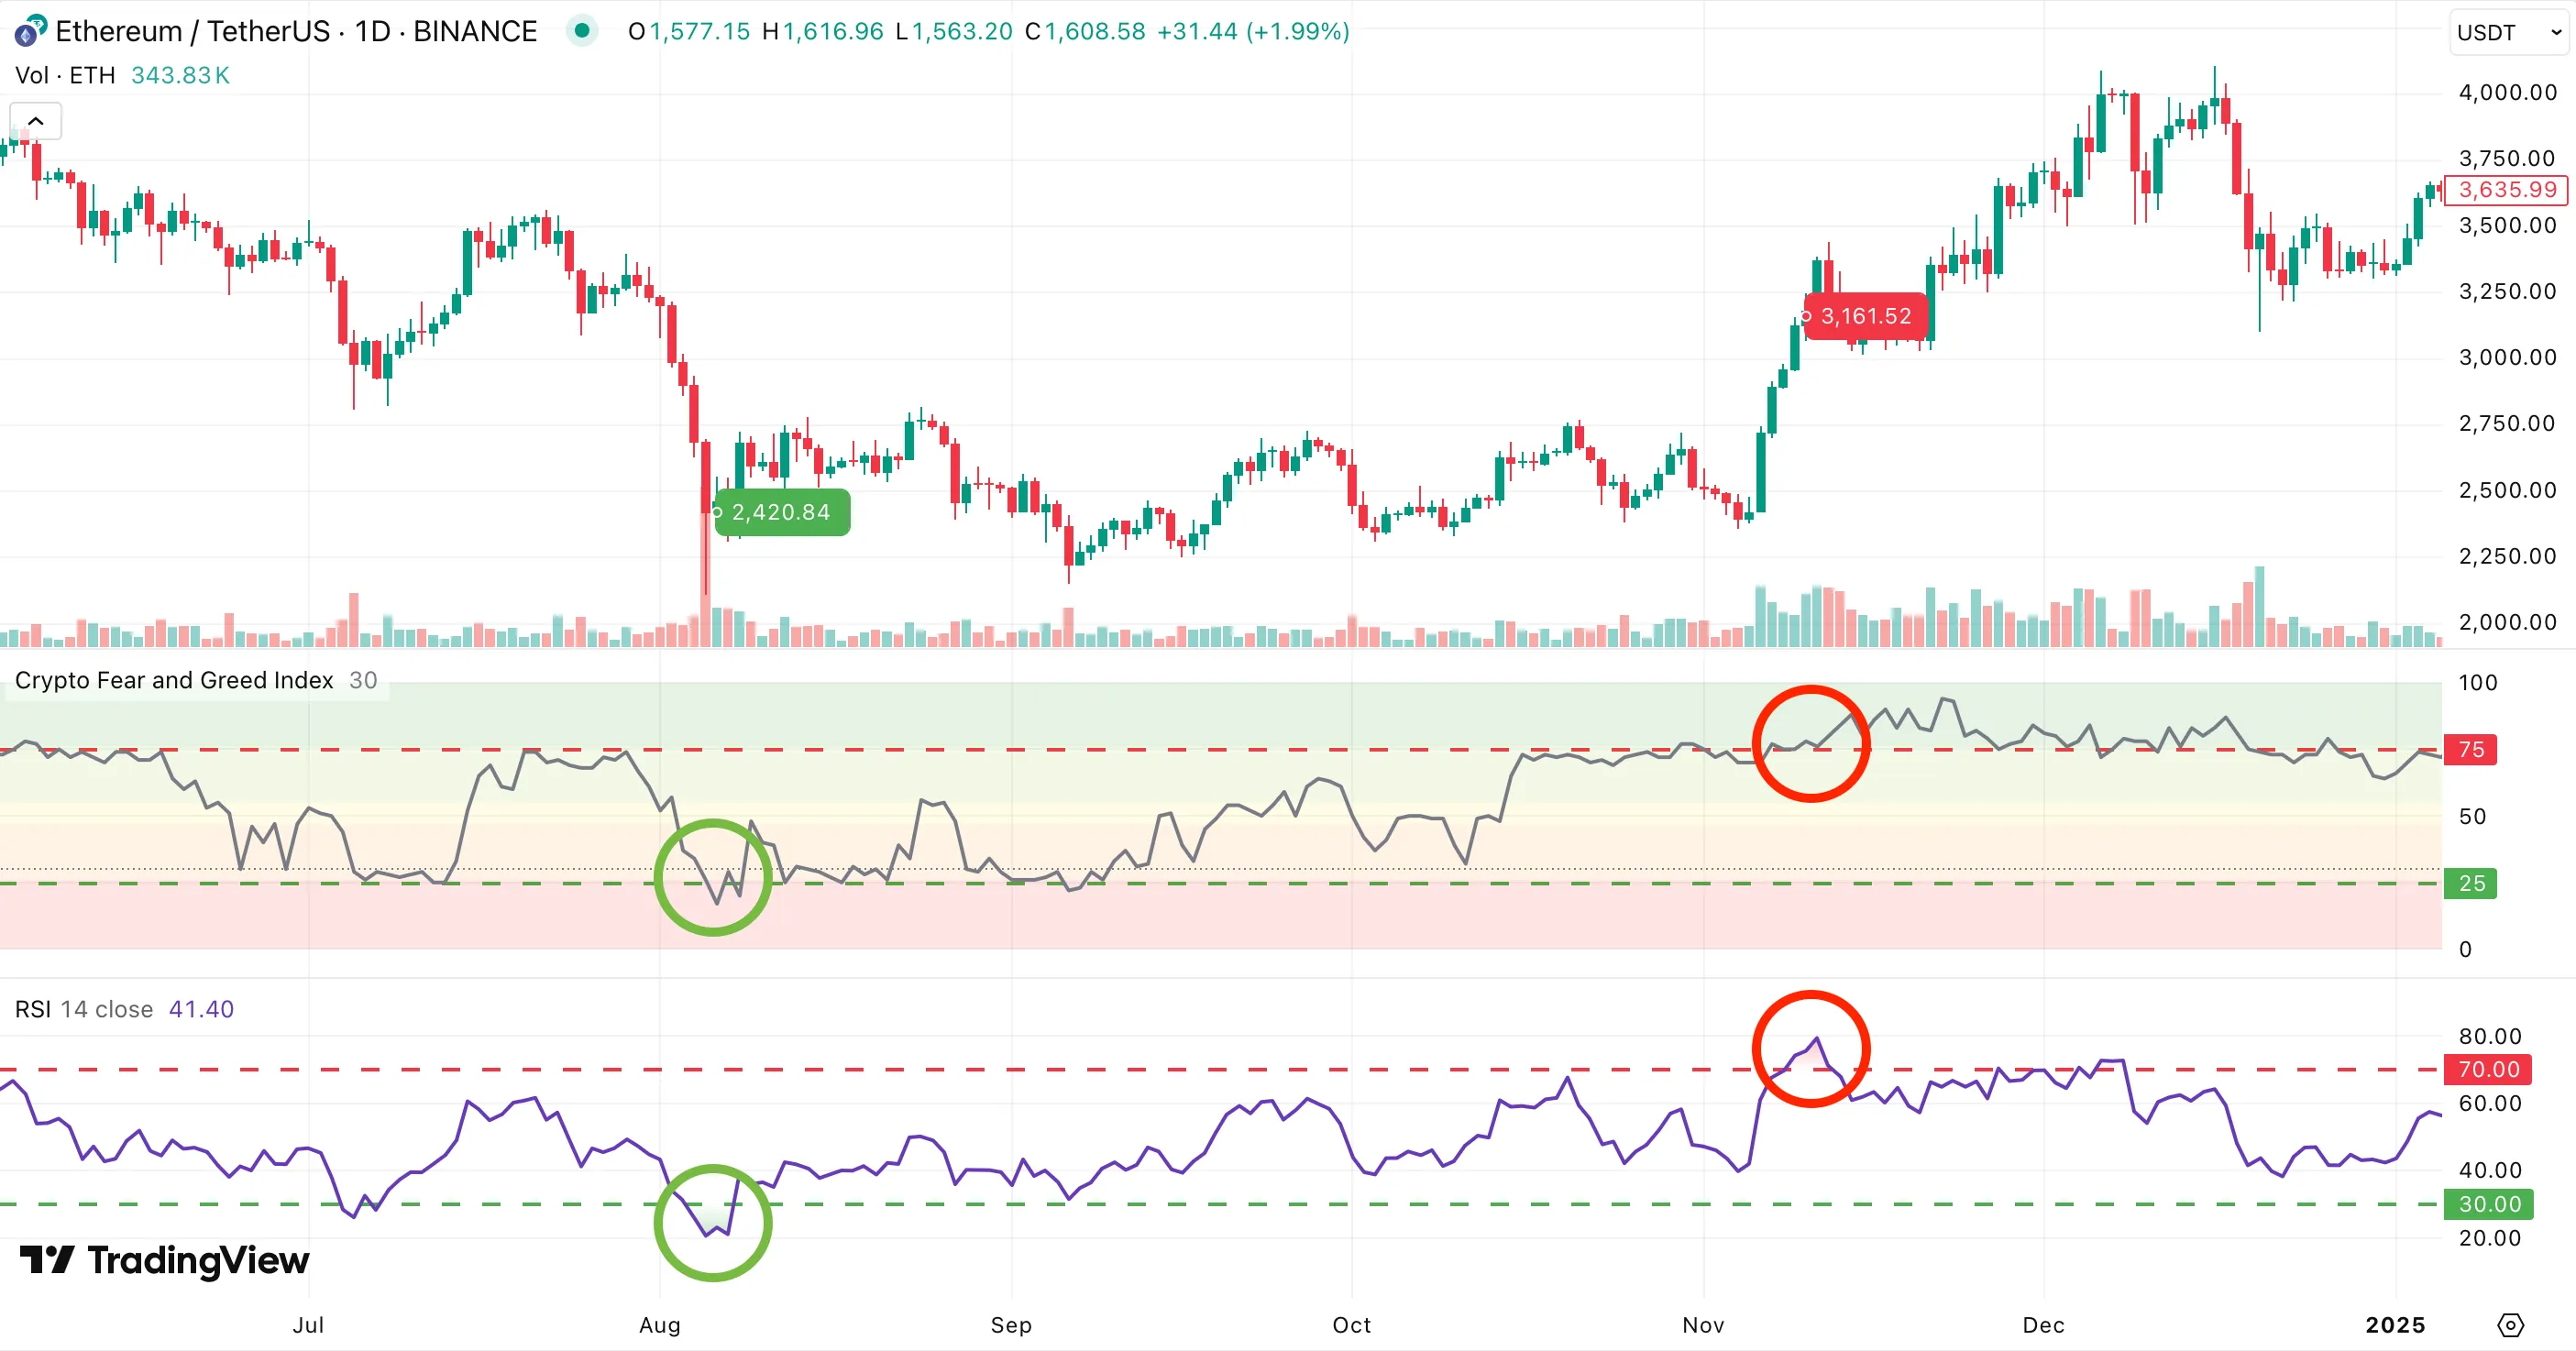
The example below shows an ETH/USDT chart with the Crypto Fear & Greed Index as well as the RSI displayed below it. Green markers highlight buy signals where the Fear & Greed Index drops below 25 and the RSI falls below 30 at the same time. Red markers show sell signals where the Fear & Greed Index rises above 75 and the RSI goes above 70 together.
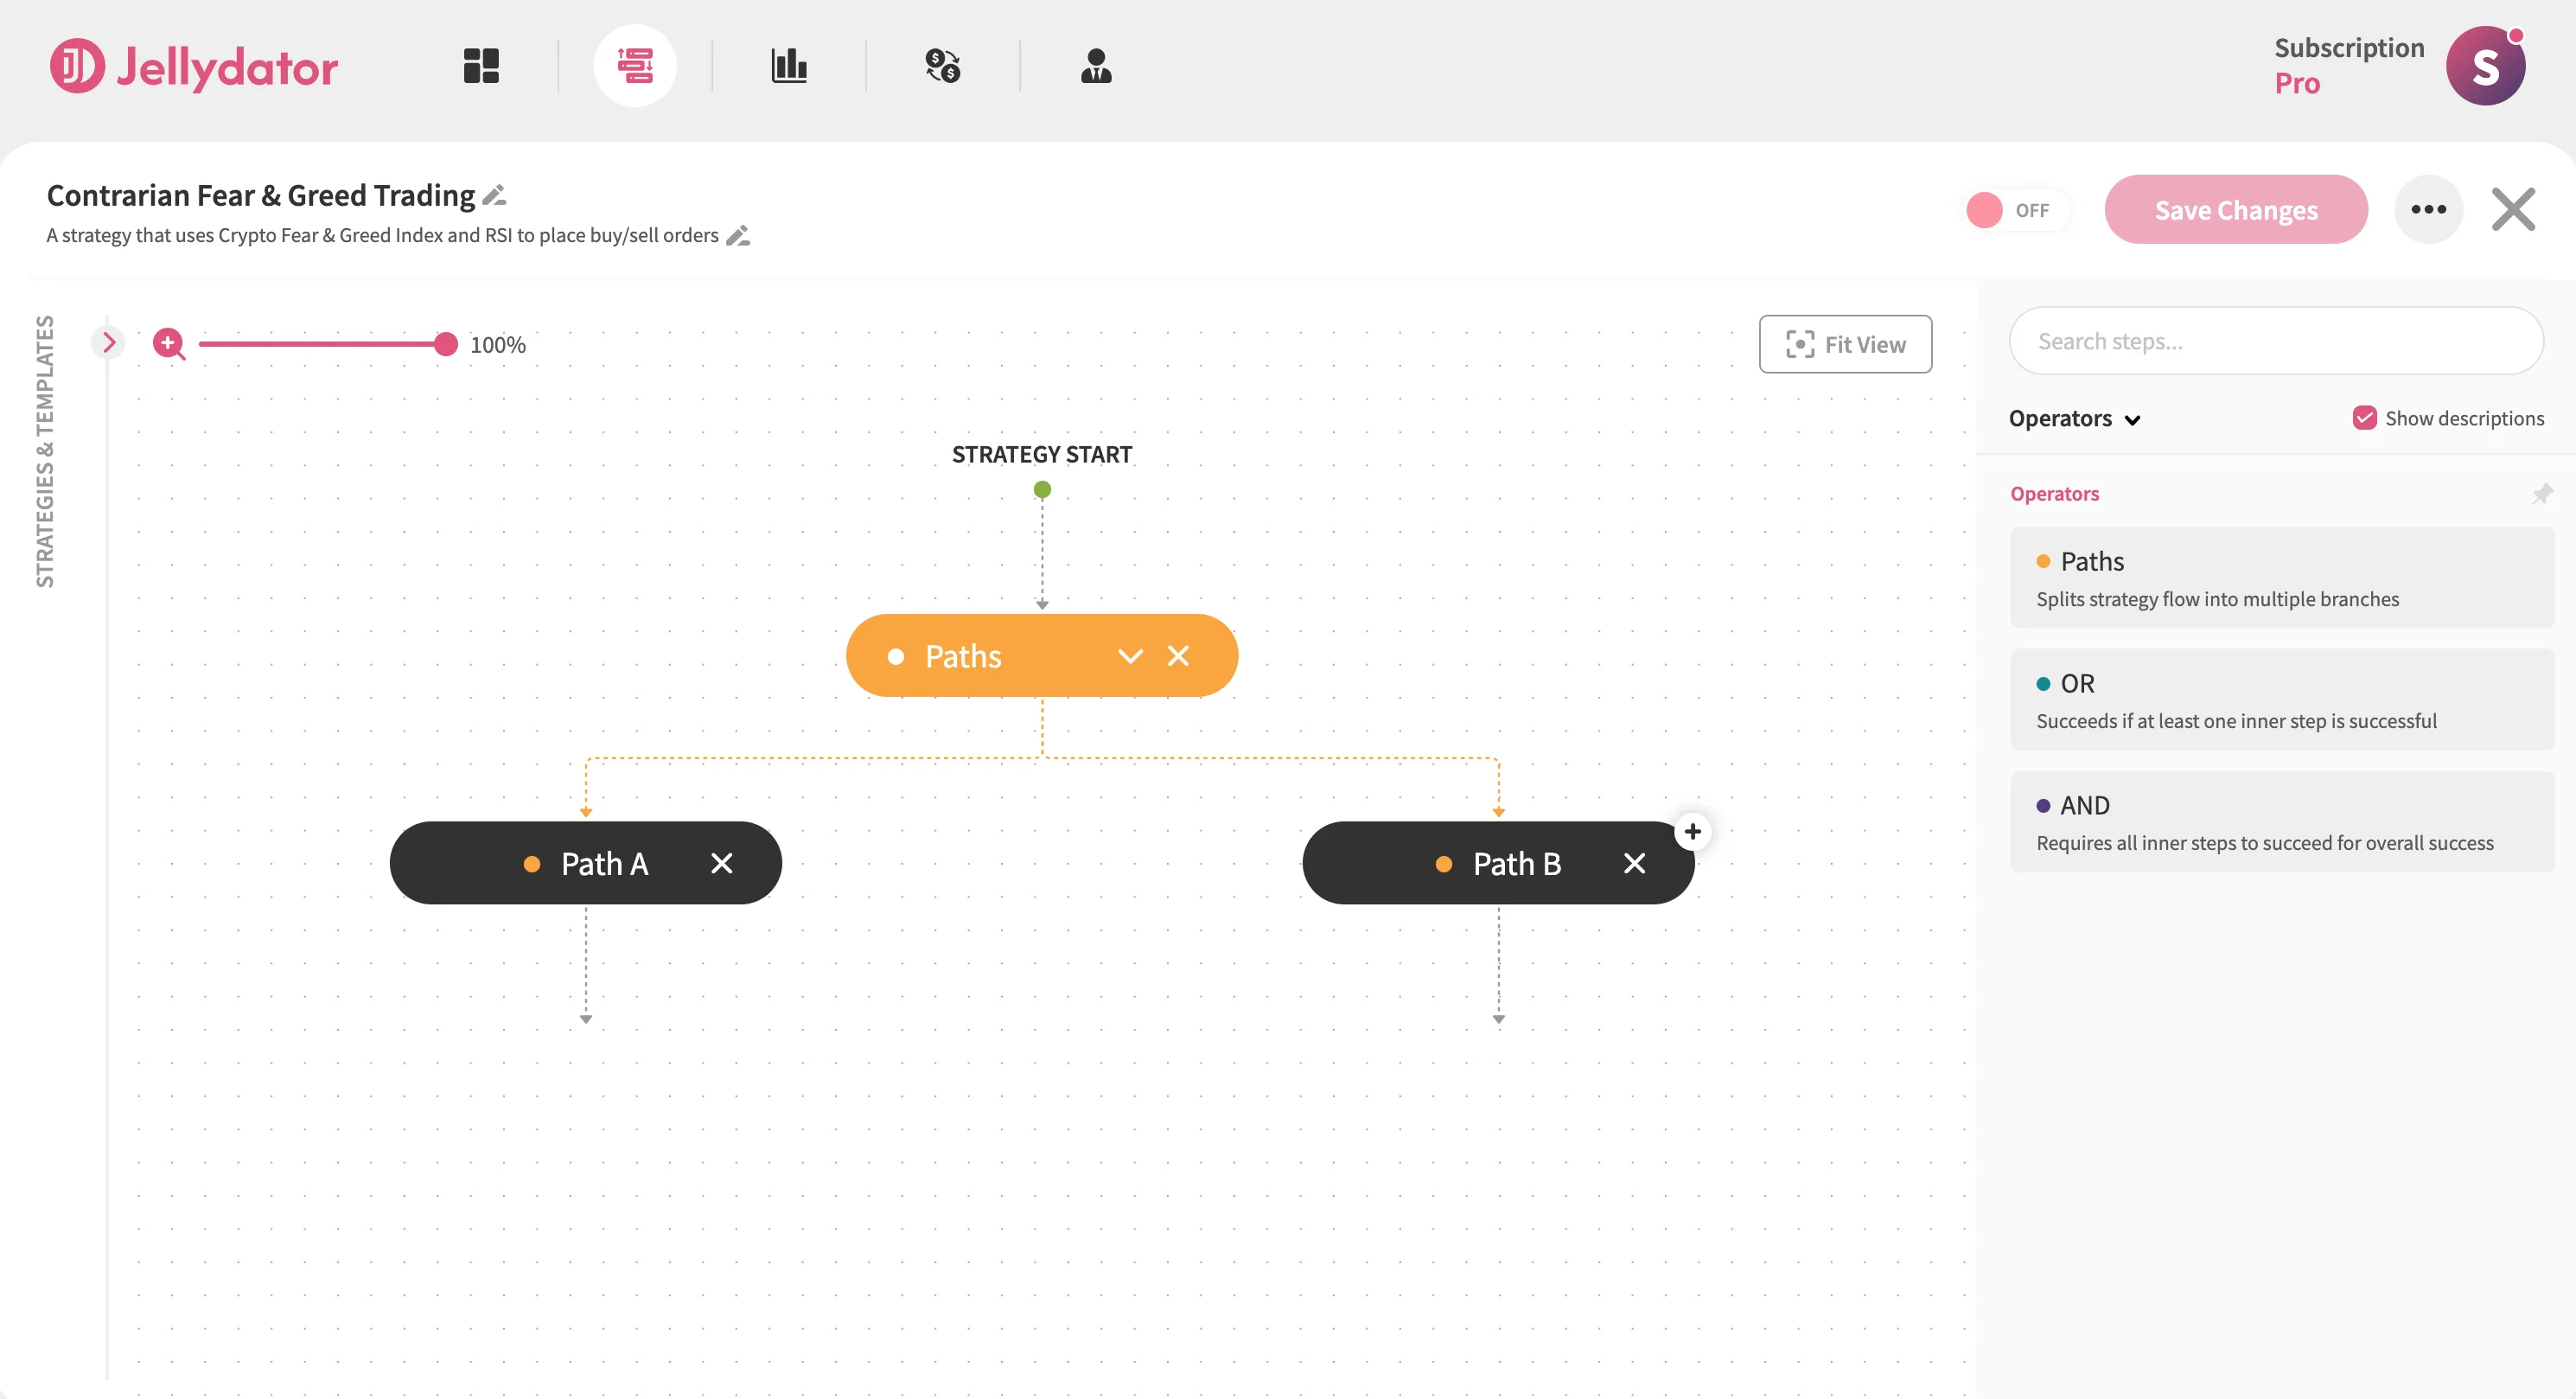
How to Build It on Jellydator
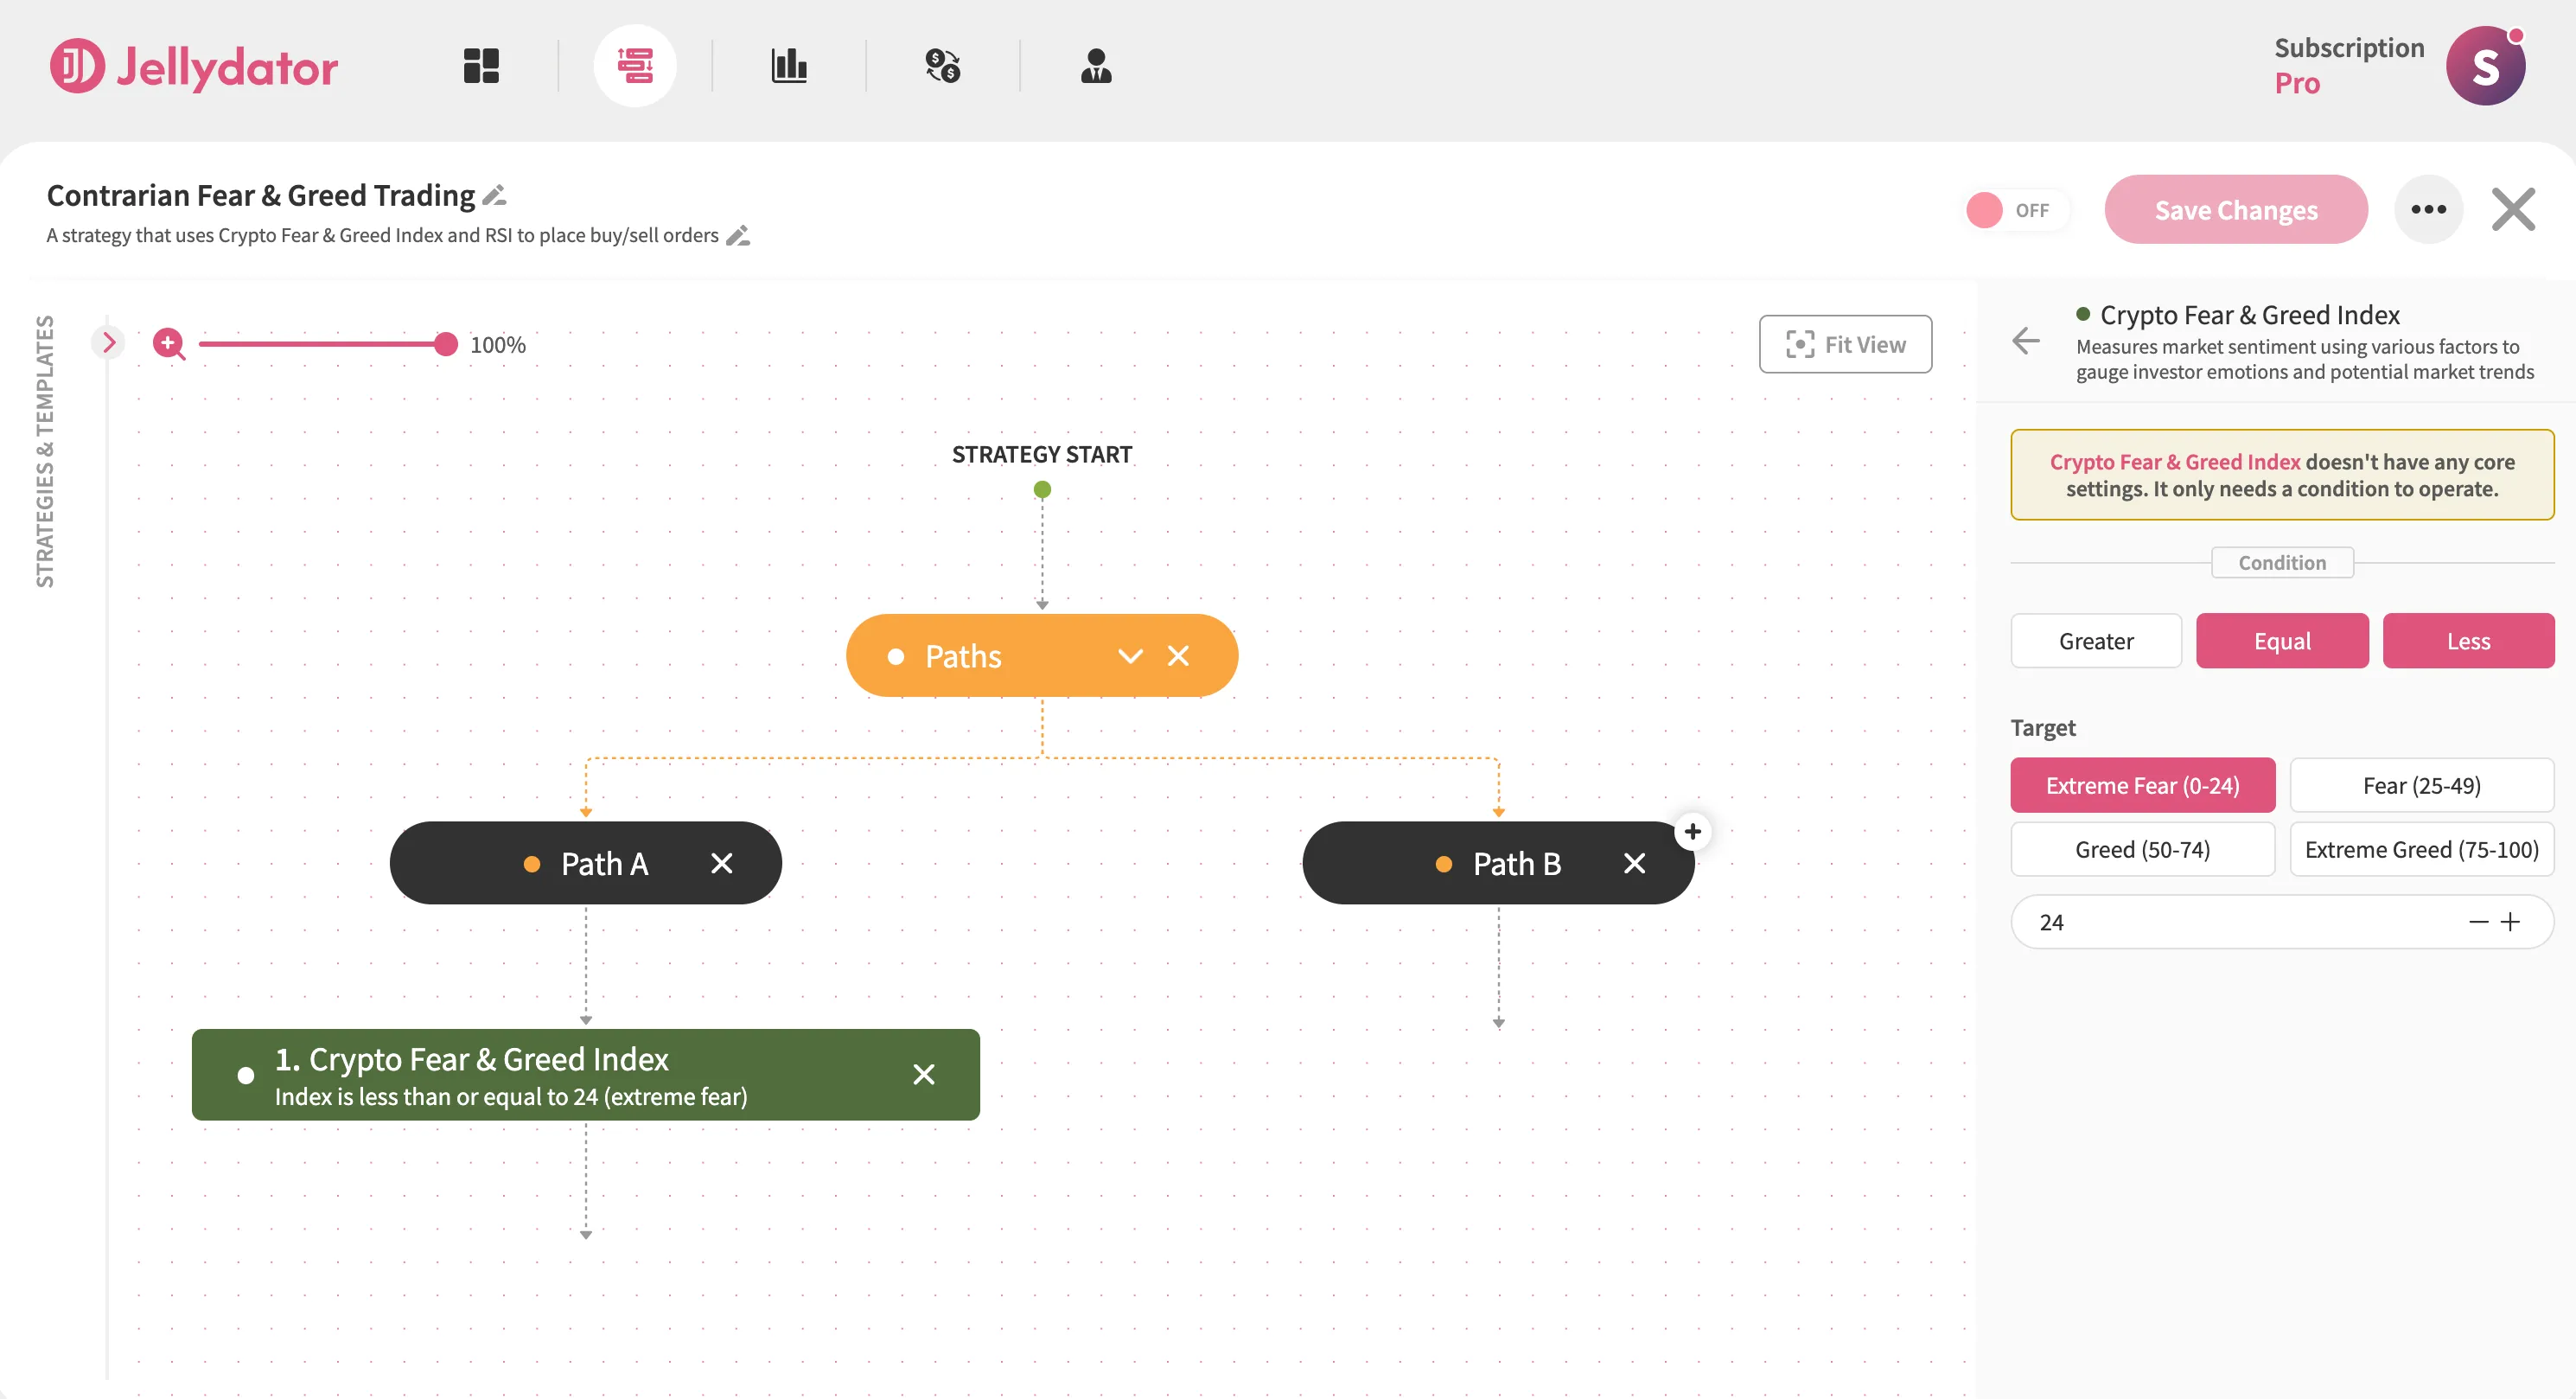
Start by adding a Paths step to your Jellydator editor. This creates two parallel decision paths for your strategy.
Path A Configuration
In Path A, add a Crypto Fear & Greed Index step and select it to open the configuration panel. In the “Condition” section, choose Equal and Less as the operator to establish the “Index Value ≤ Your Target” condition. Then, in the “Target” input field, enter “24”.
Then, below the Crypto Fear & Greed Index step, add a Relative Strength Index (RSI) step and select it to open its configuration panel. Choose the 4-hour candle interval for your target asset (we’ll use ETH/USDT in this guide). In the “Condition” section, choose Equal and Less as the operator to establish the “Index Value ≤ Your Target” condition.
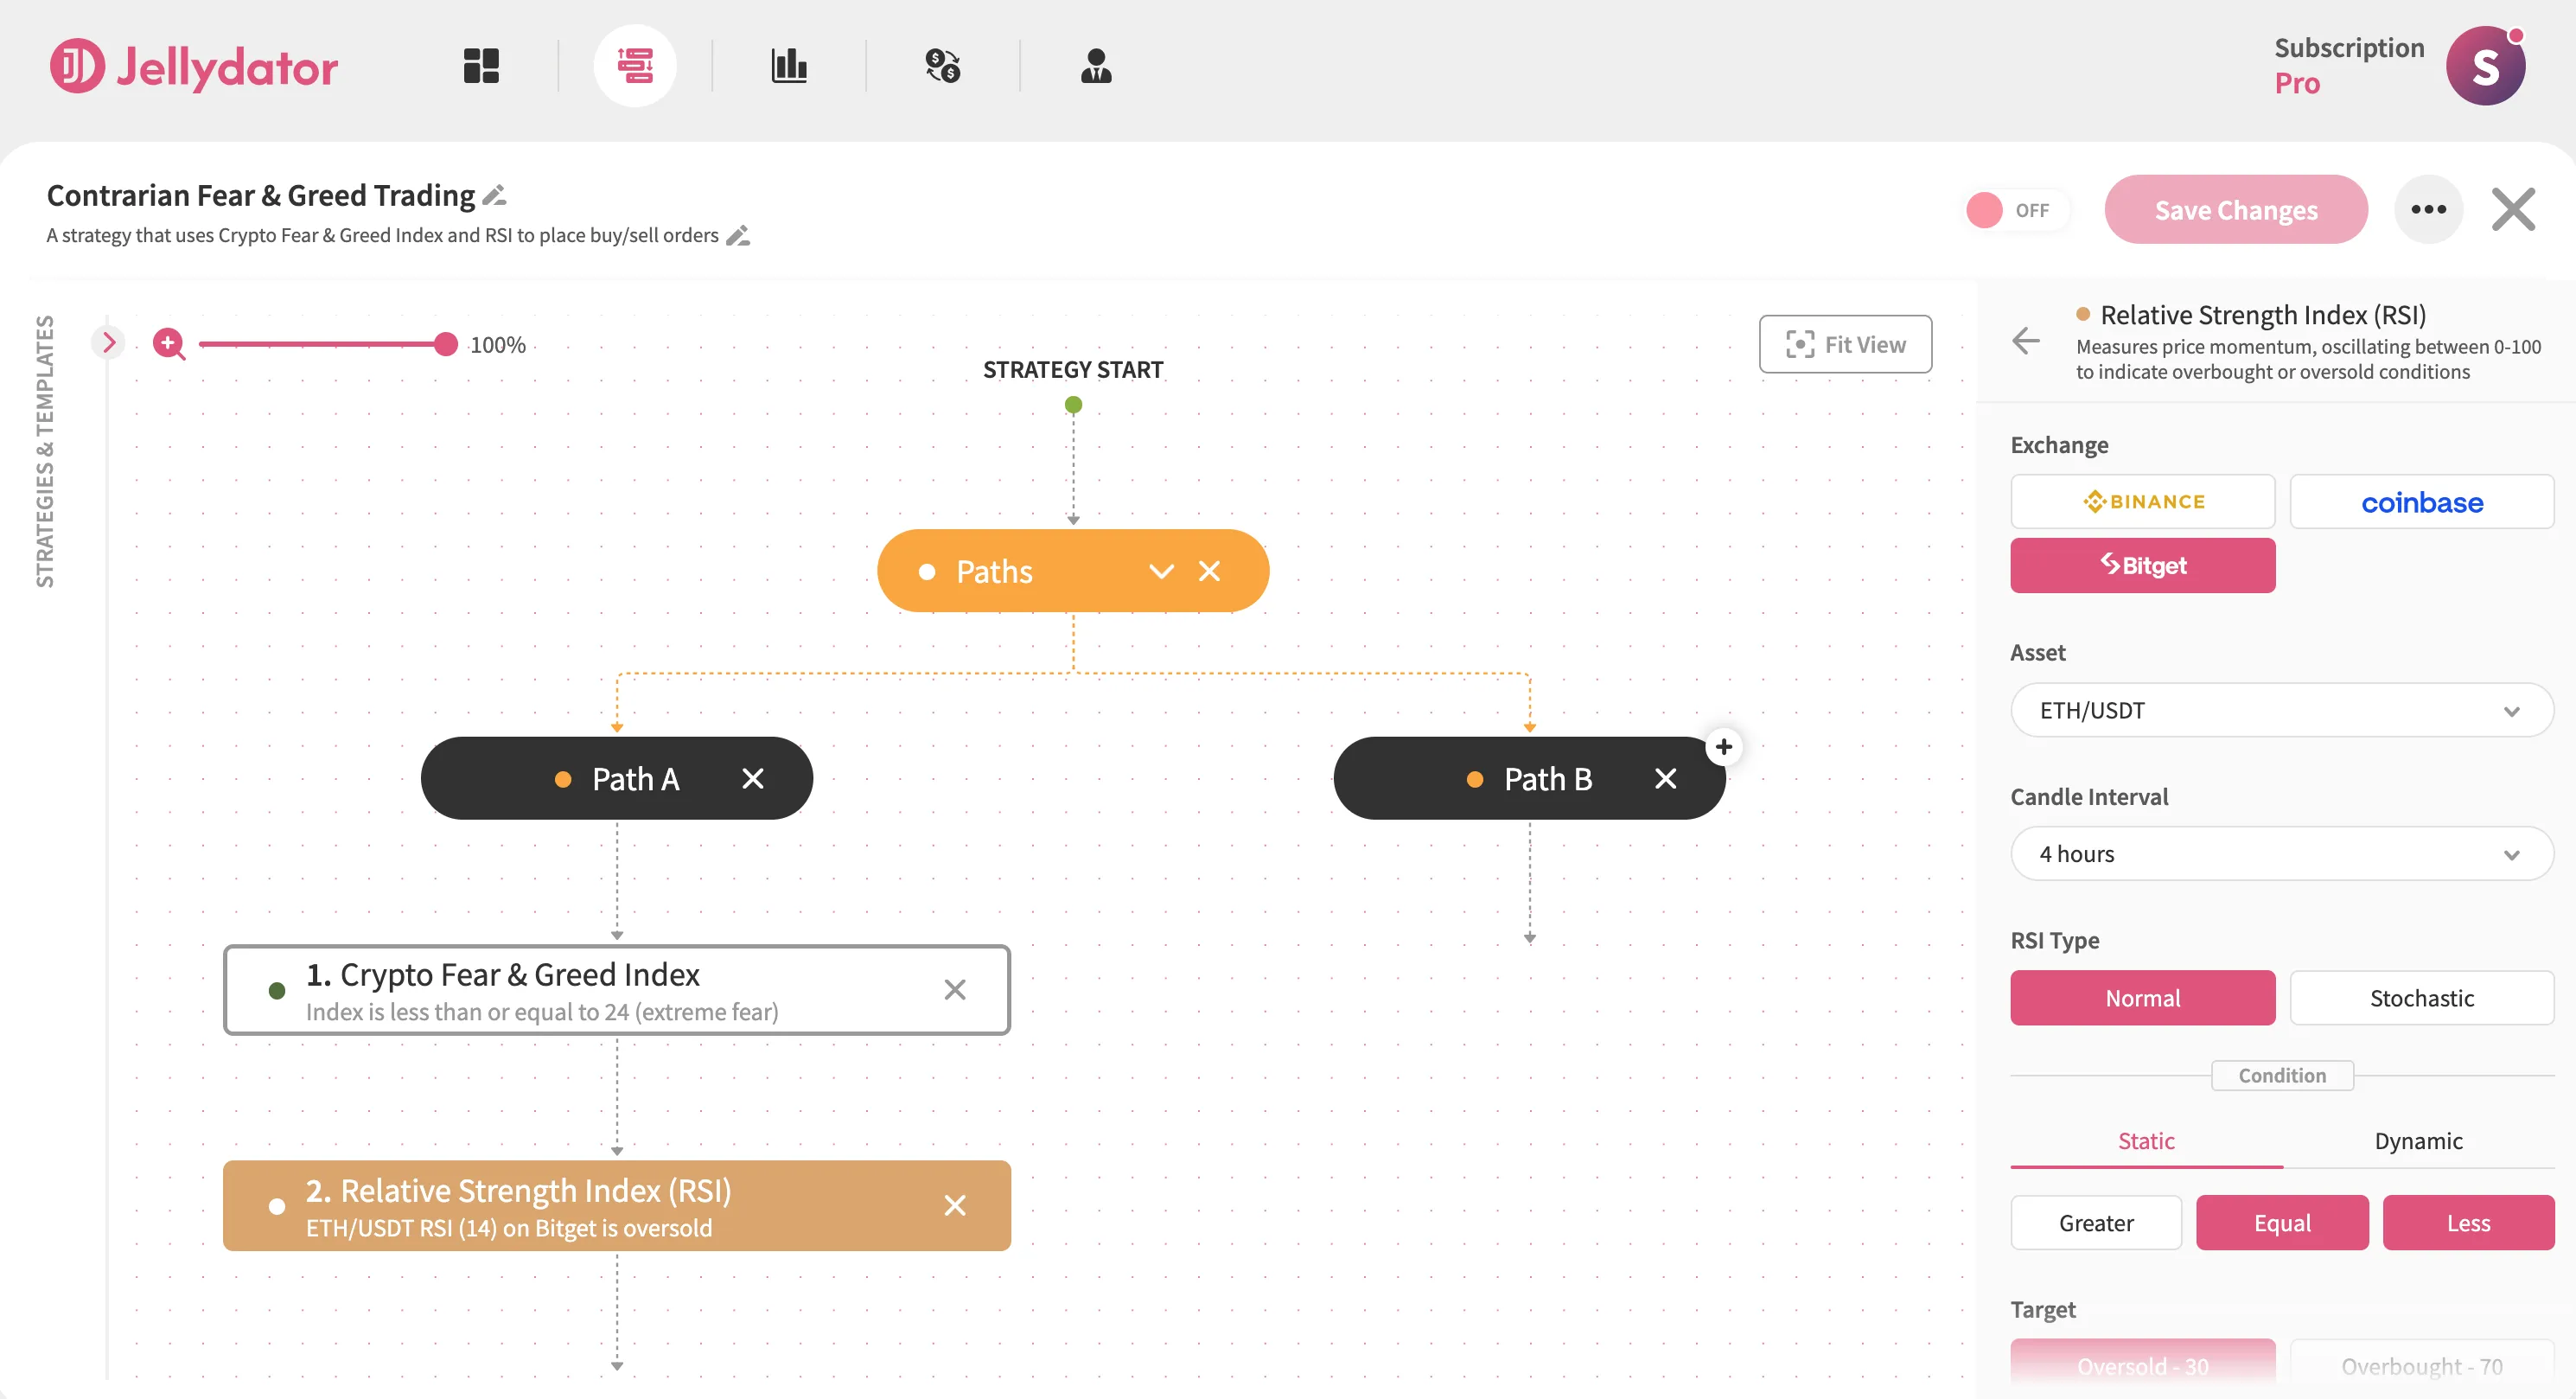
Scroll down until you see the “Target” input field and enter “30”.

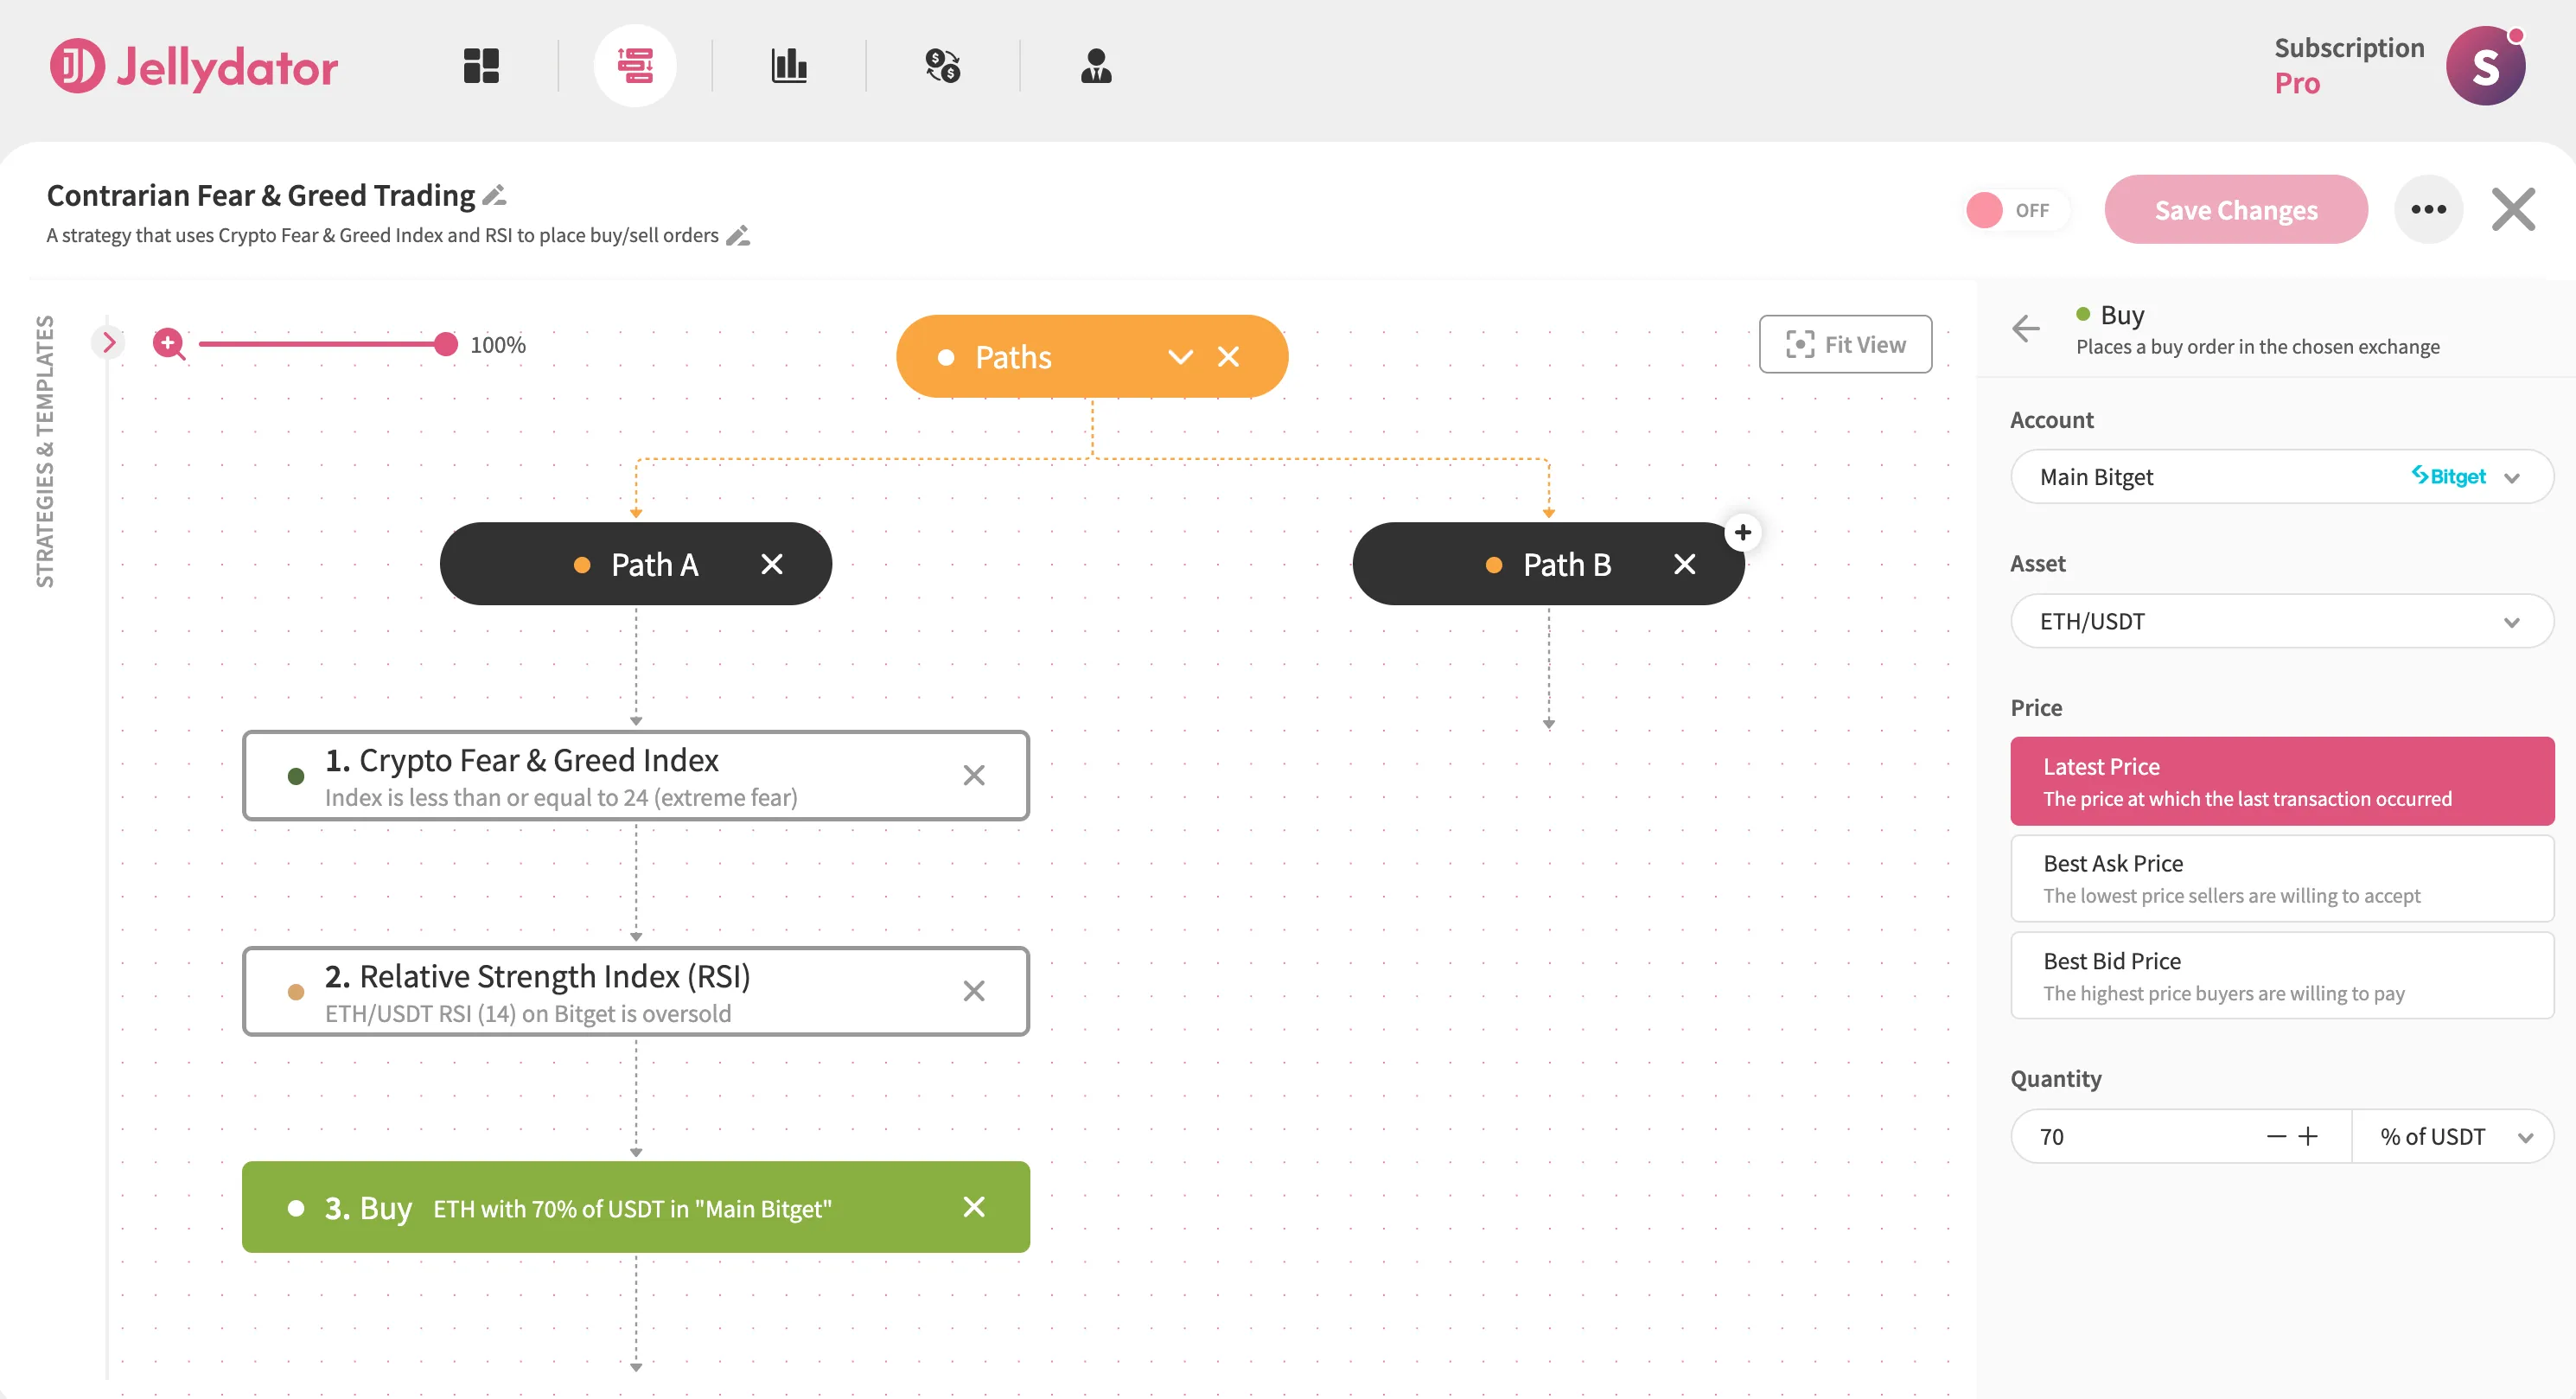
To complete Path A, add a Buy step configured for ETH/USDT directly beneath the RSI step. In its configuration panel, select the “Latest Price” option and allocate 70% of your USDT balance.
Path B Configuration
In Path B, add another Crypto Fear & Greed Index step and access its configuration panel. In the “Condition” section, choose Greater and Equal as the operator to establish the “Index Value ≥ Your Target” condition. Then, in the “Target” input field, enter “75”.

Then, below the Crypto Fear & Greed Index step in Path B, add another Relative Strength Index (RSI) step. In its configuration panel, choose the 4-hour candle interval for your target asset. Make sure that the asset matches the one that you’re using in the other RSI step (in this guide, it’s ETH/USDT). In the “Condition” section, choose Greater and Equal as the operator to establish the “Index Value ≥ Your Target” condition.
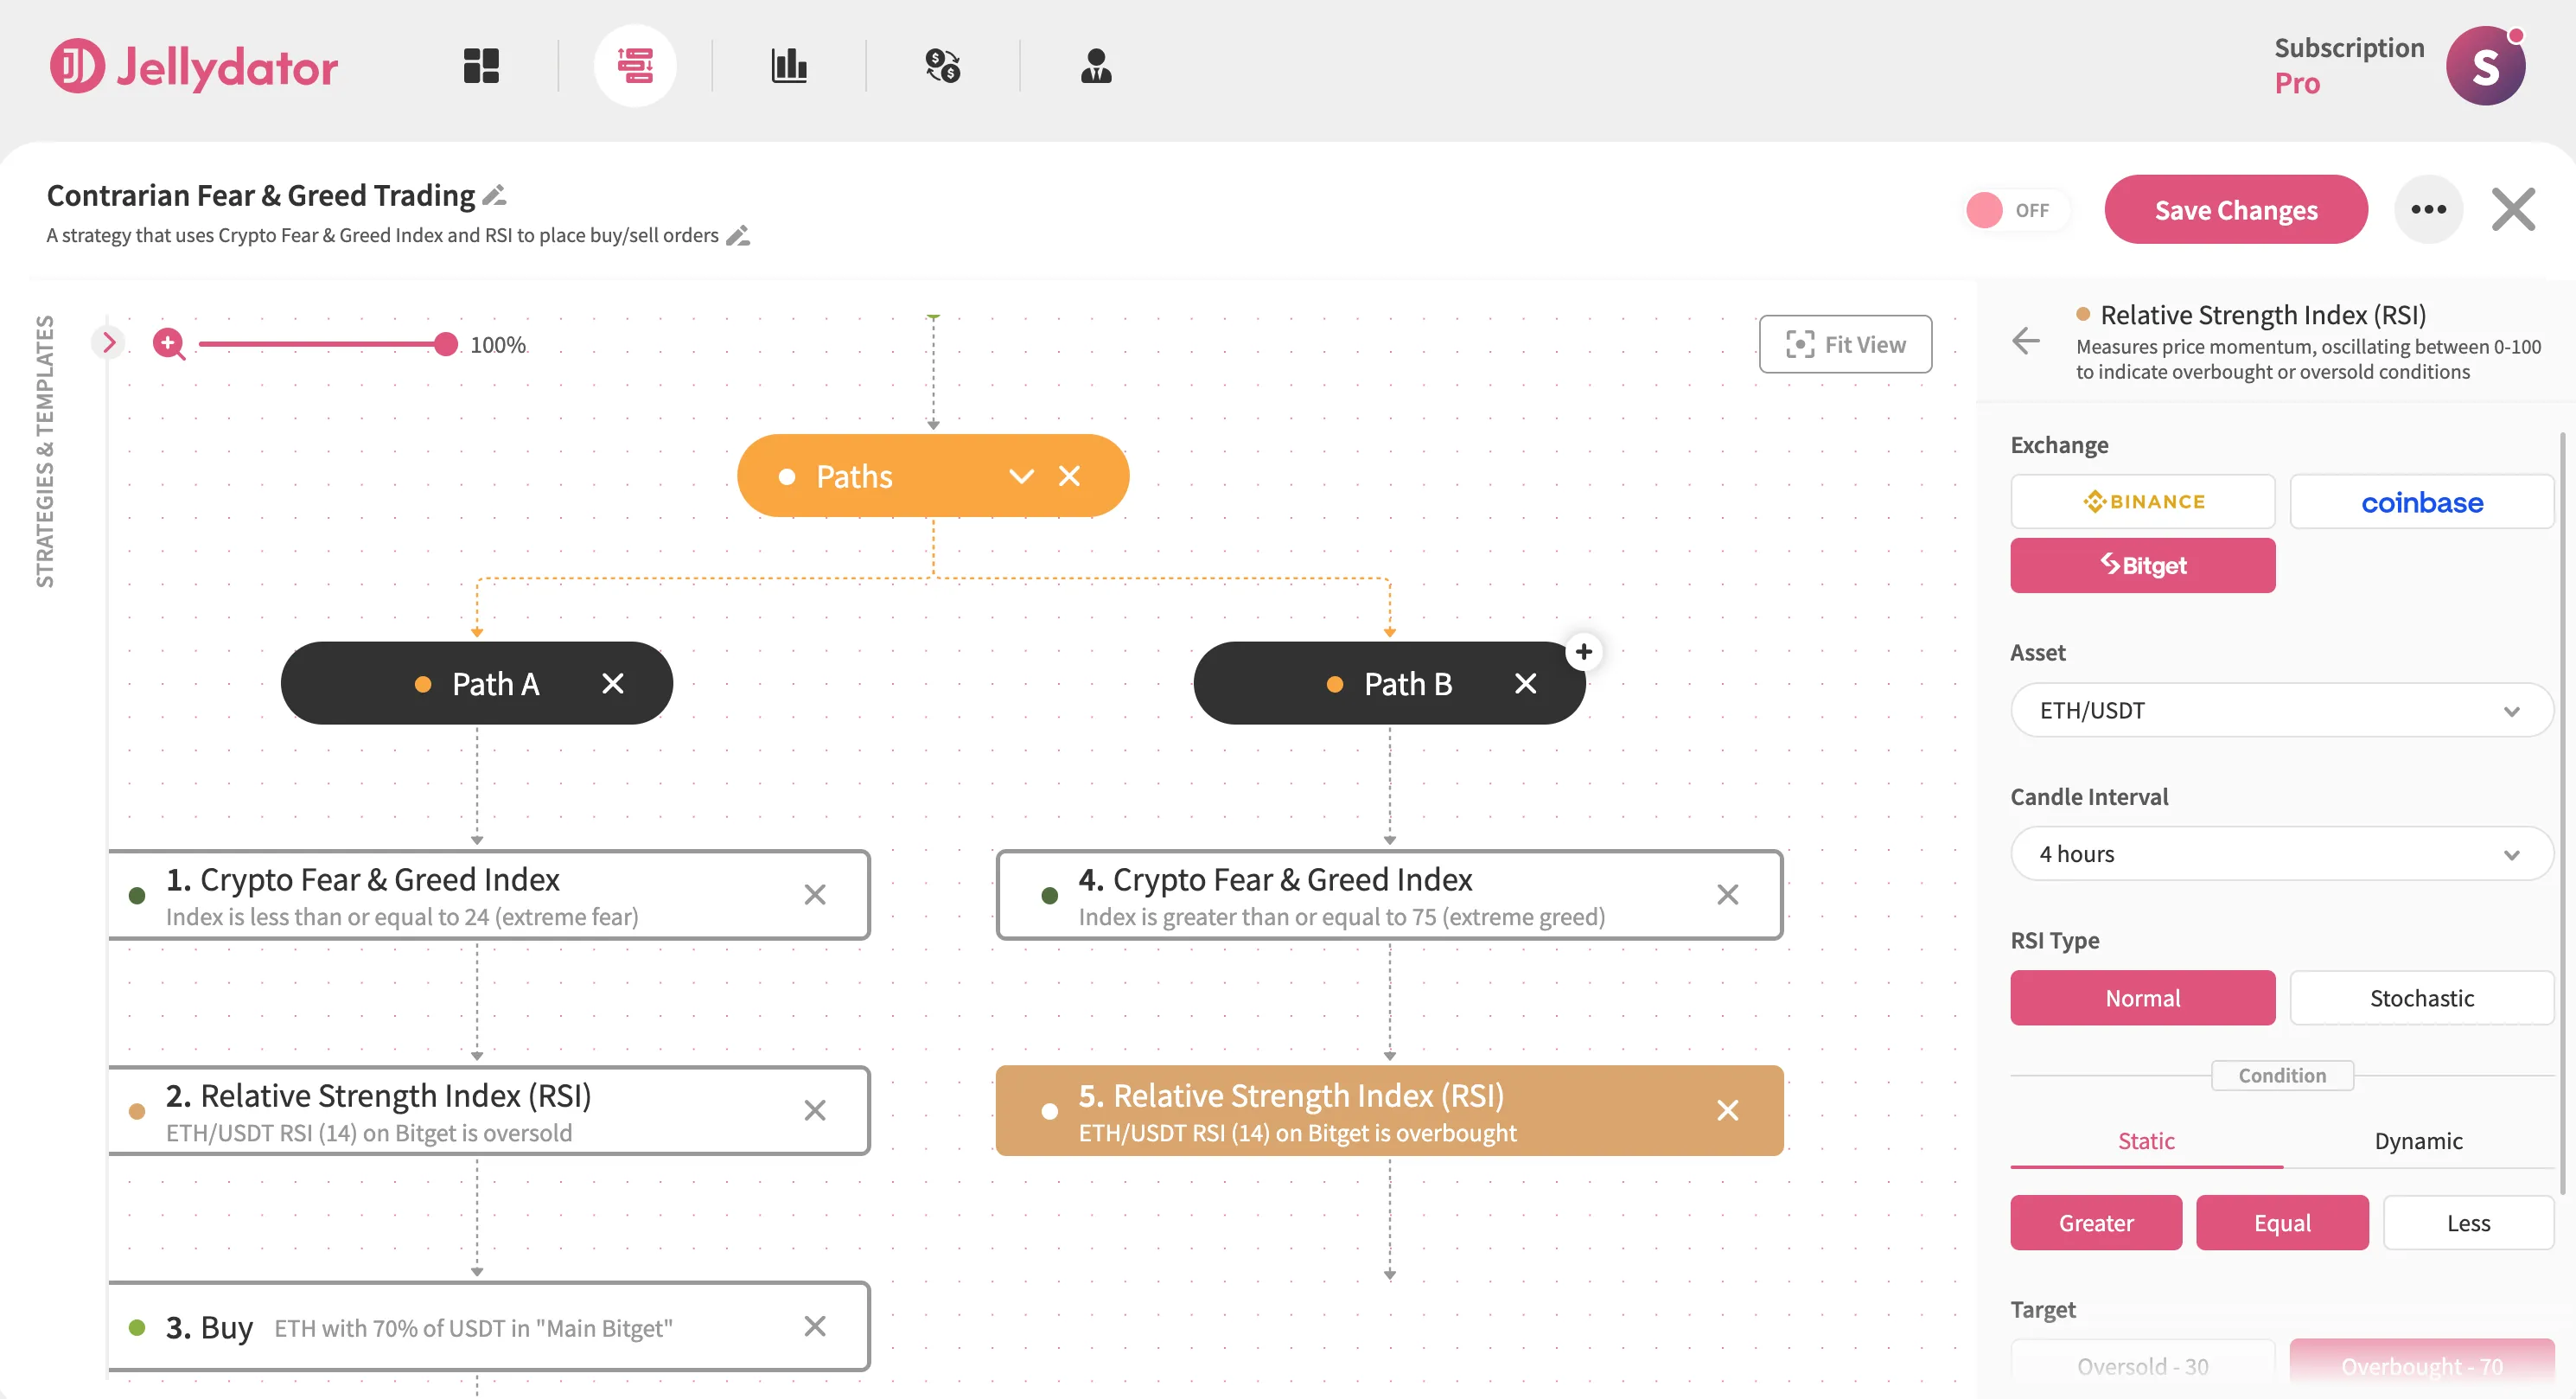
Then, scroll down until you see the “Target” input field and enter “70”.

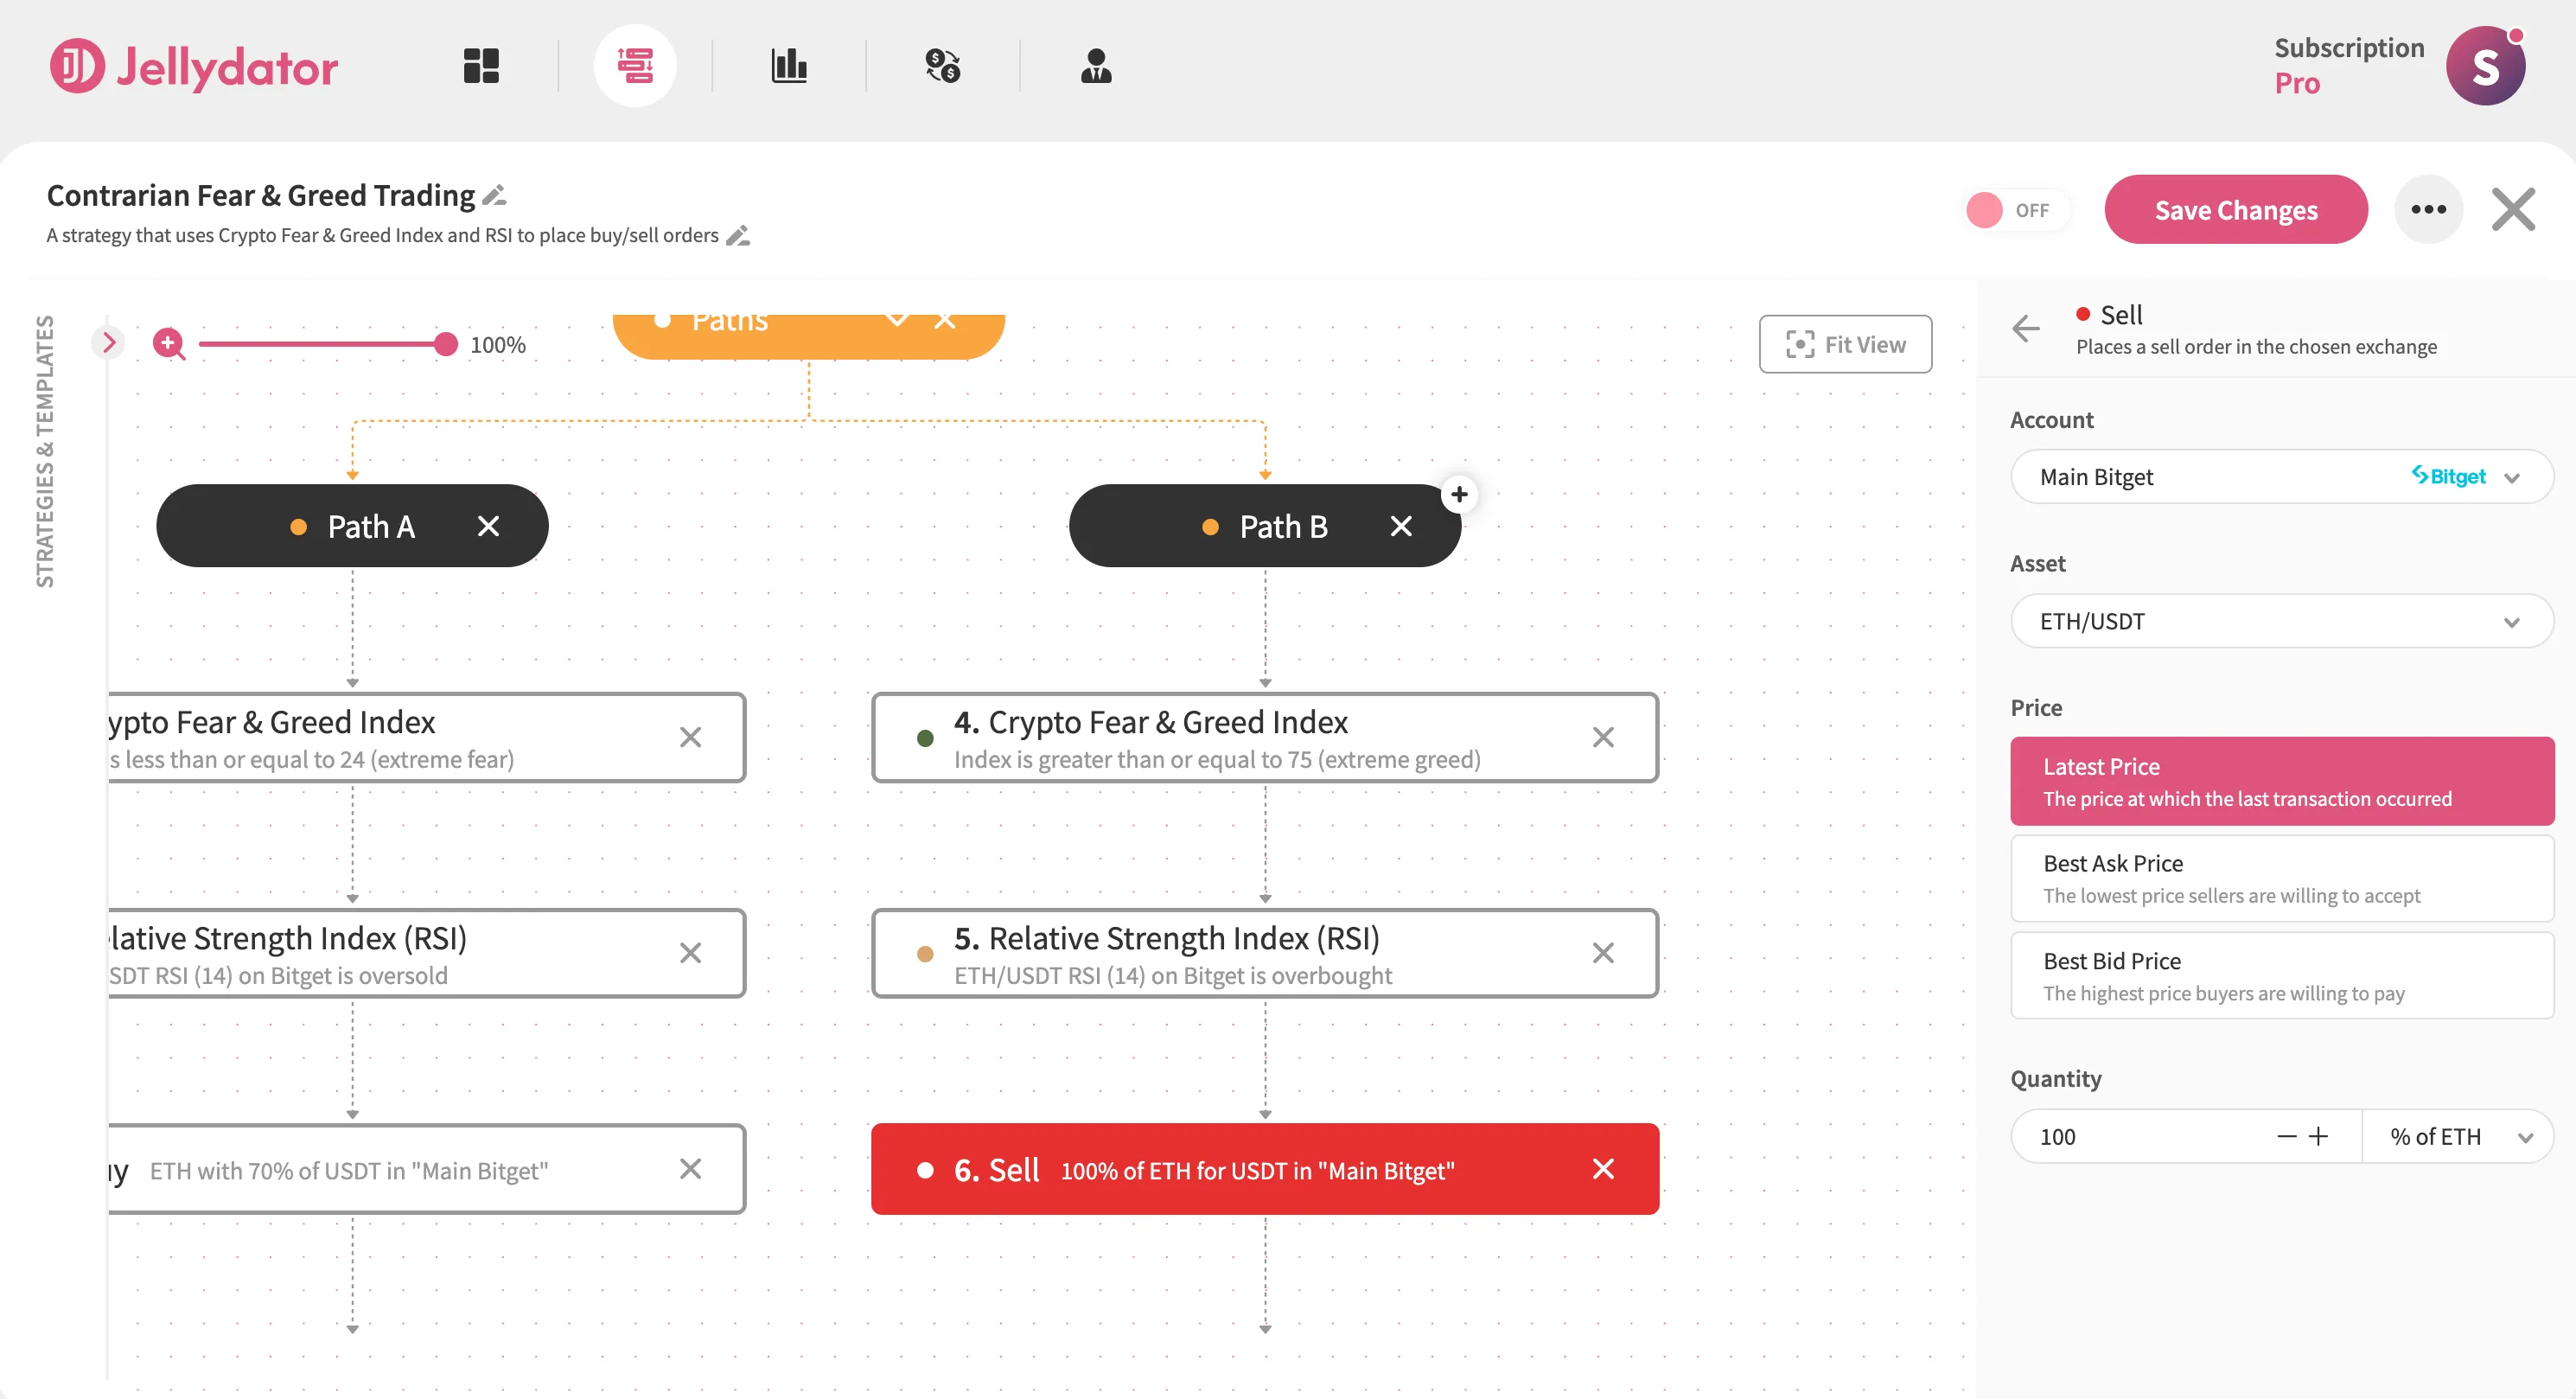
Below this step, place a Sell step. It should use the same asset pair and price option as the Buy step. Set the quantity value to 100% of your ETH.
Additional Enhancements
Block Overlapping Orders
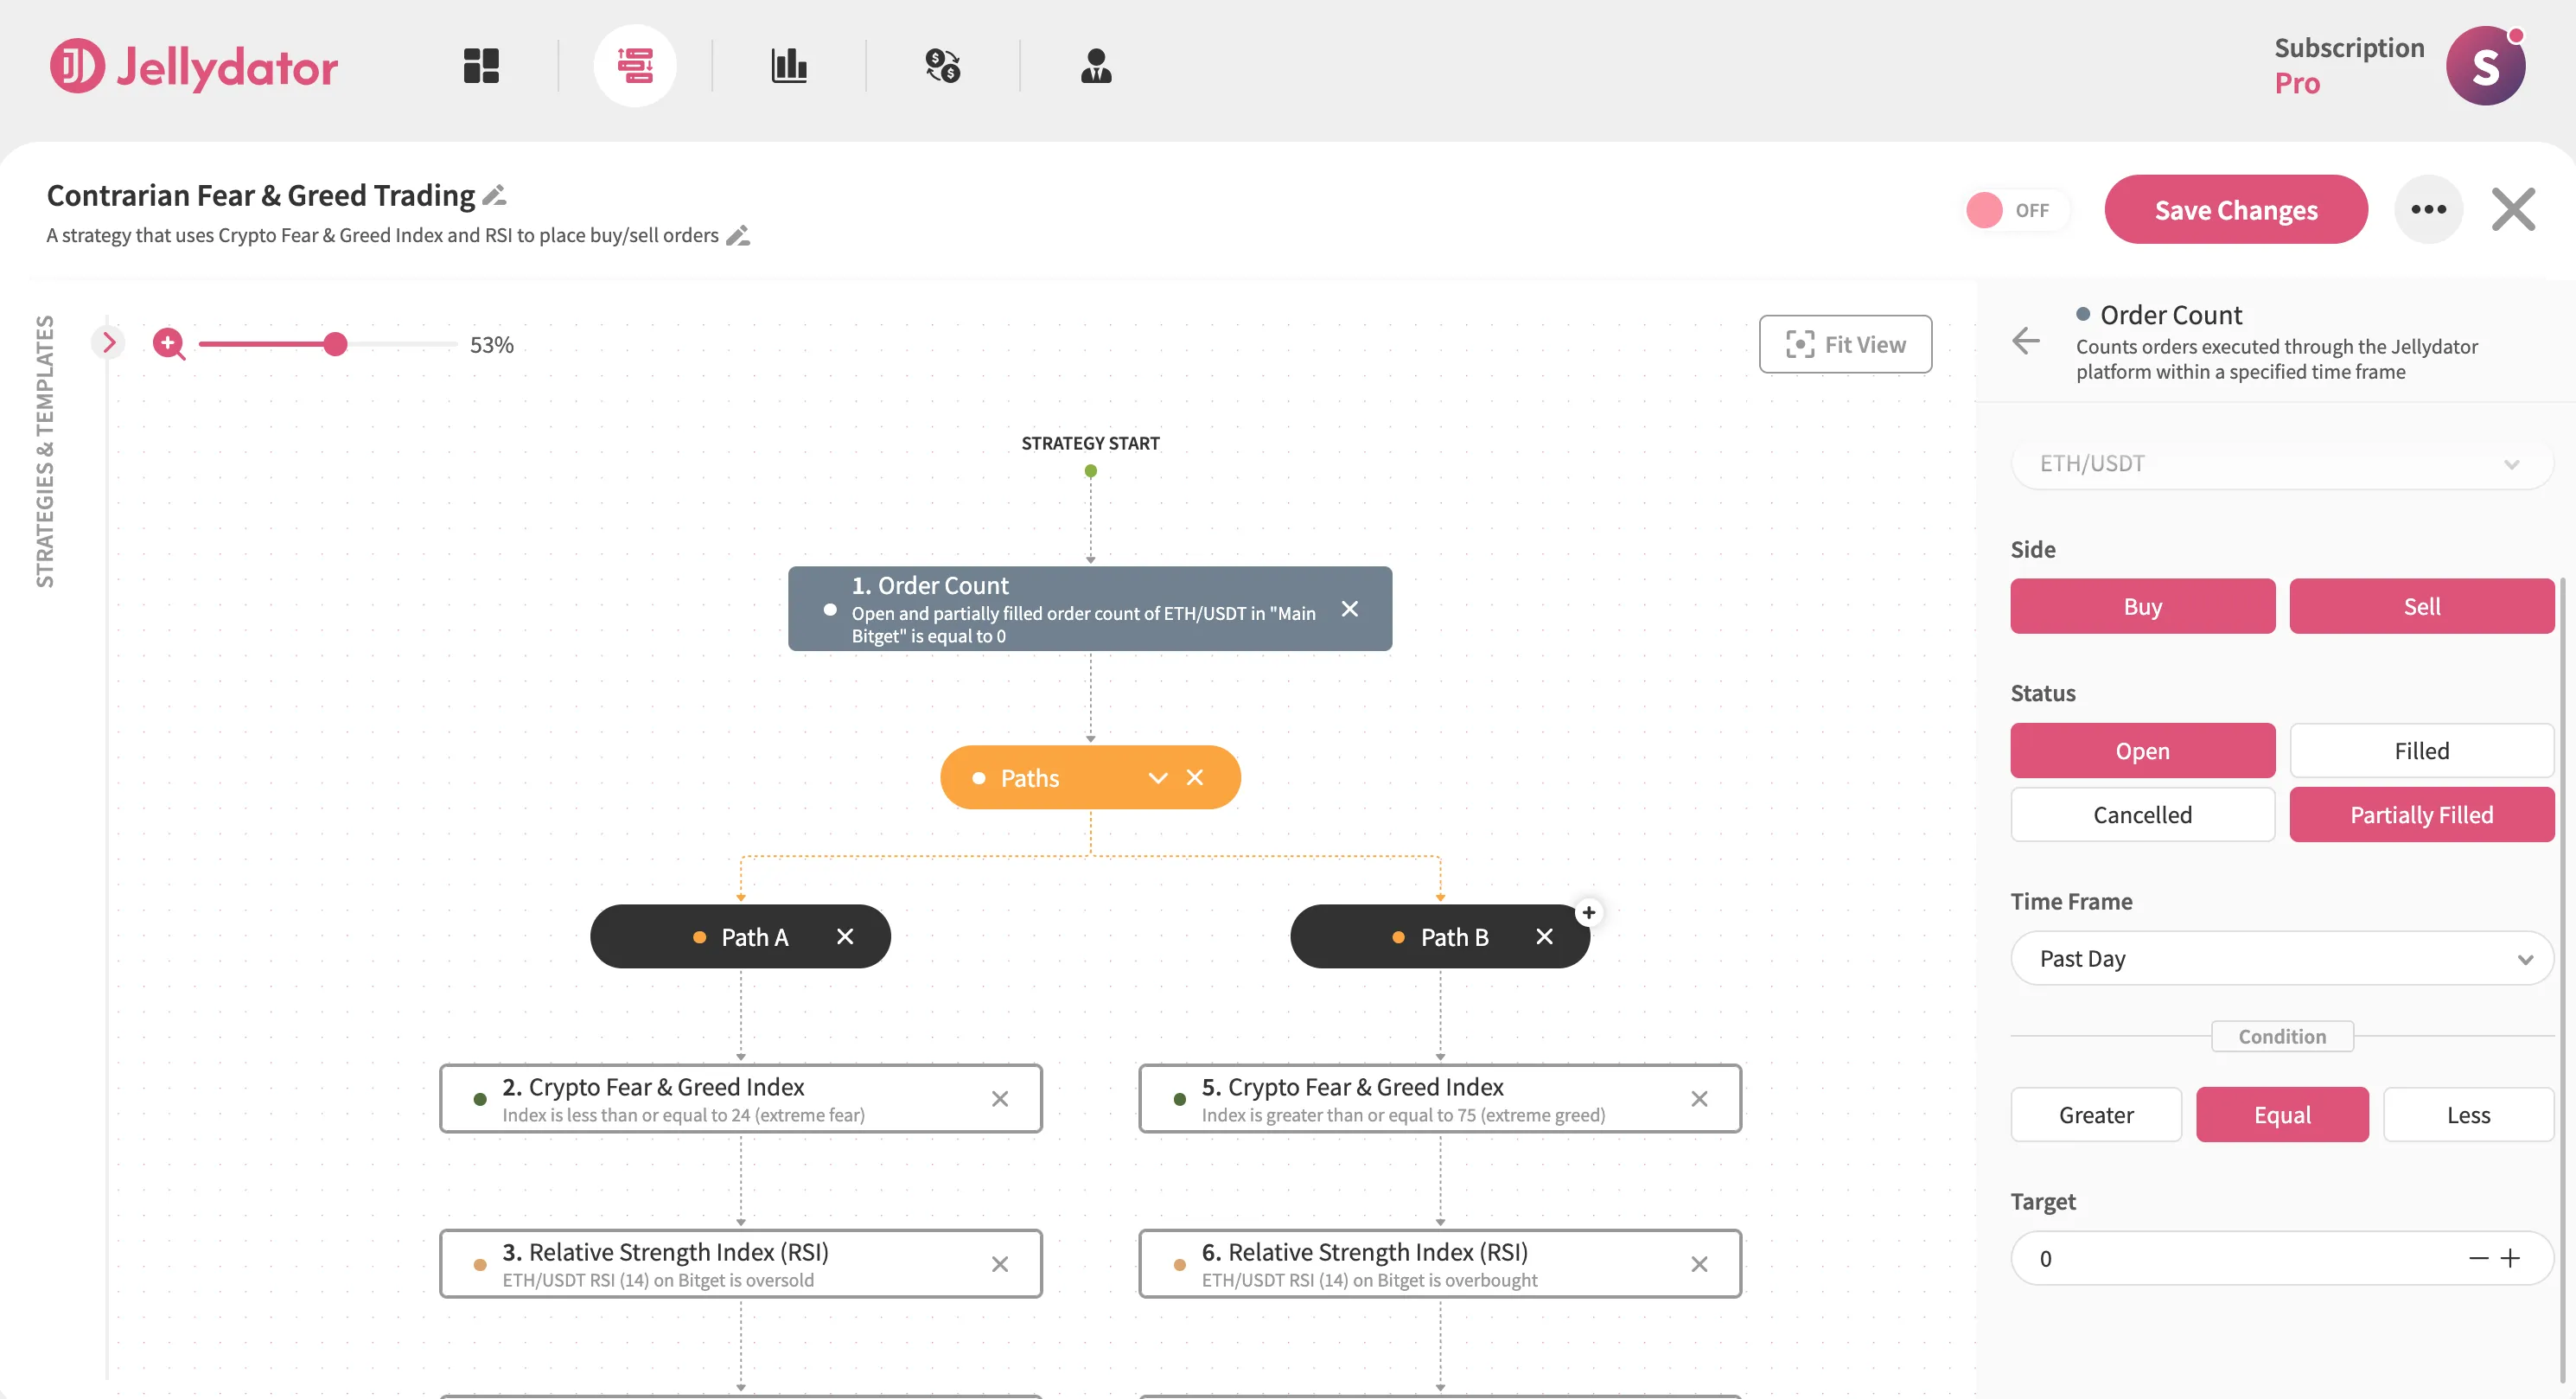
Add an Order Count step before your Paths to prevent duplicate trades. Configure it to check ETH/USDT orders with both buy and sell sides. Set status filters to “Open” and “Partially Filled.”
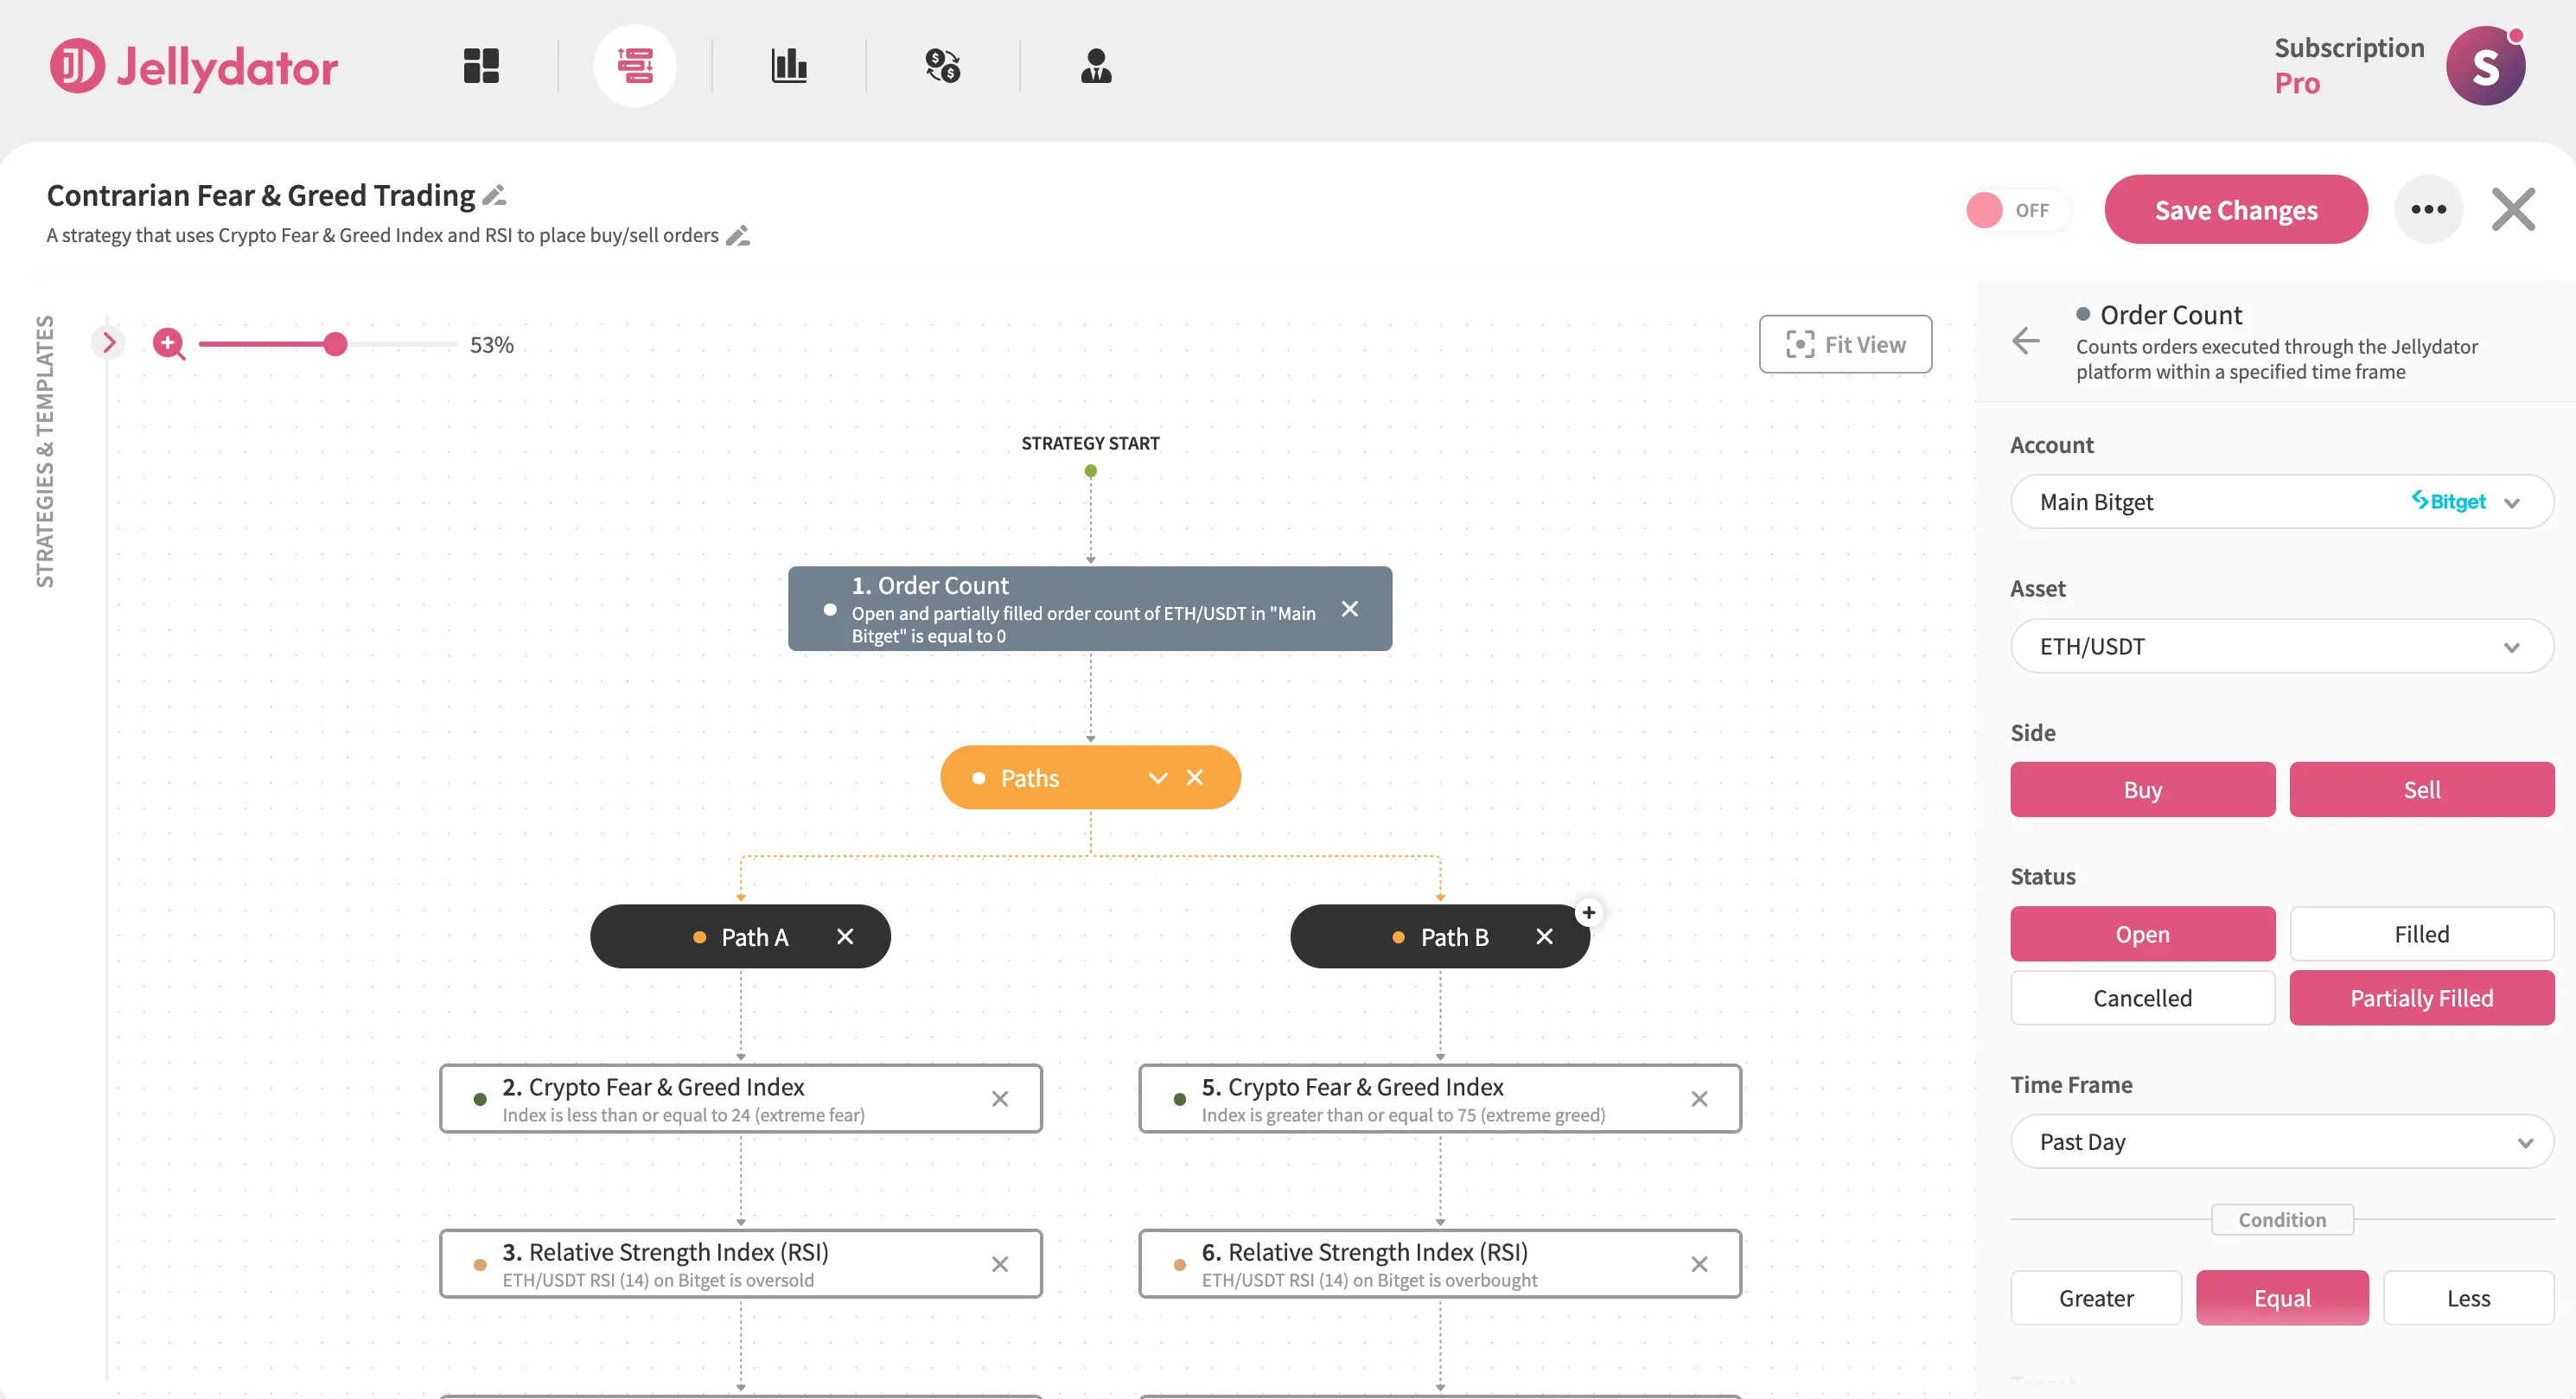
Then, create the condition “Equal to 0”. This crucial check ensures your strategy only acts when previous orders are fully completed, maintaining clean trade execution.
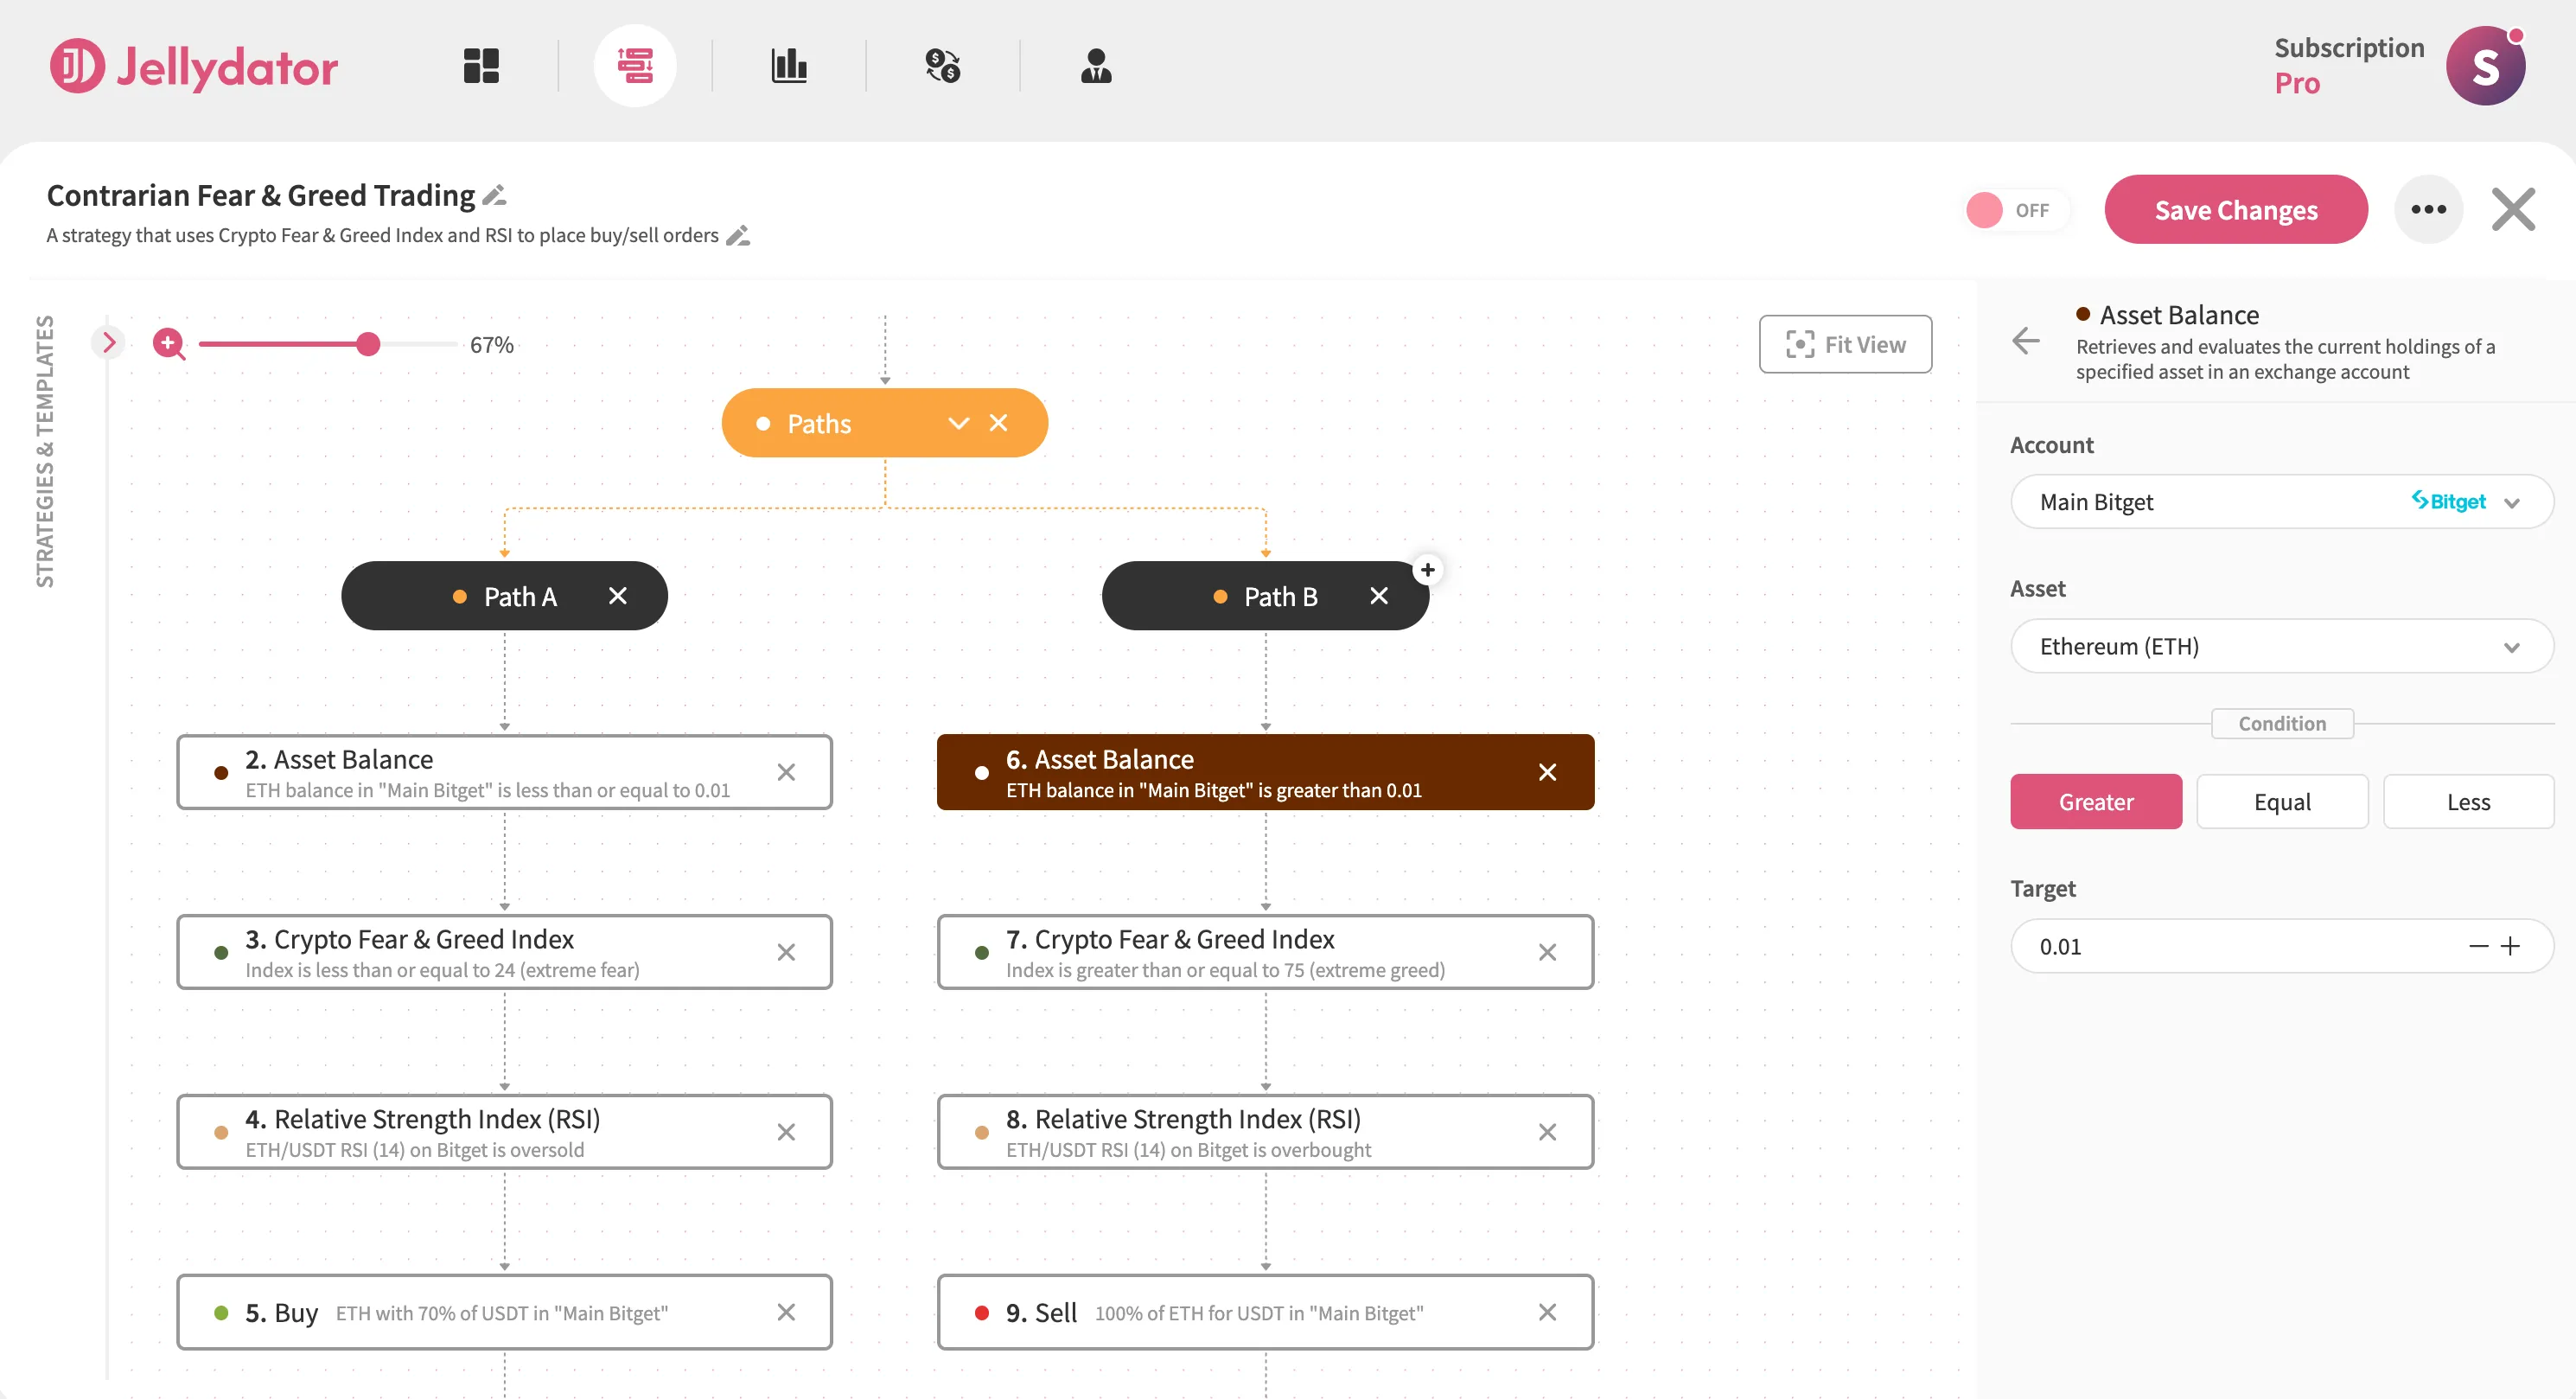
Add Balance Verification Steps
In Path A, add an Asset Balance step for ETH. Set the condition to “Less Than or Equal To” a small amount like 0.01 ETH—this ignores residual “dust” while treating your balance as effectively empty for buying.
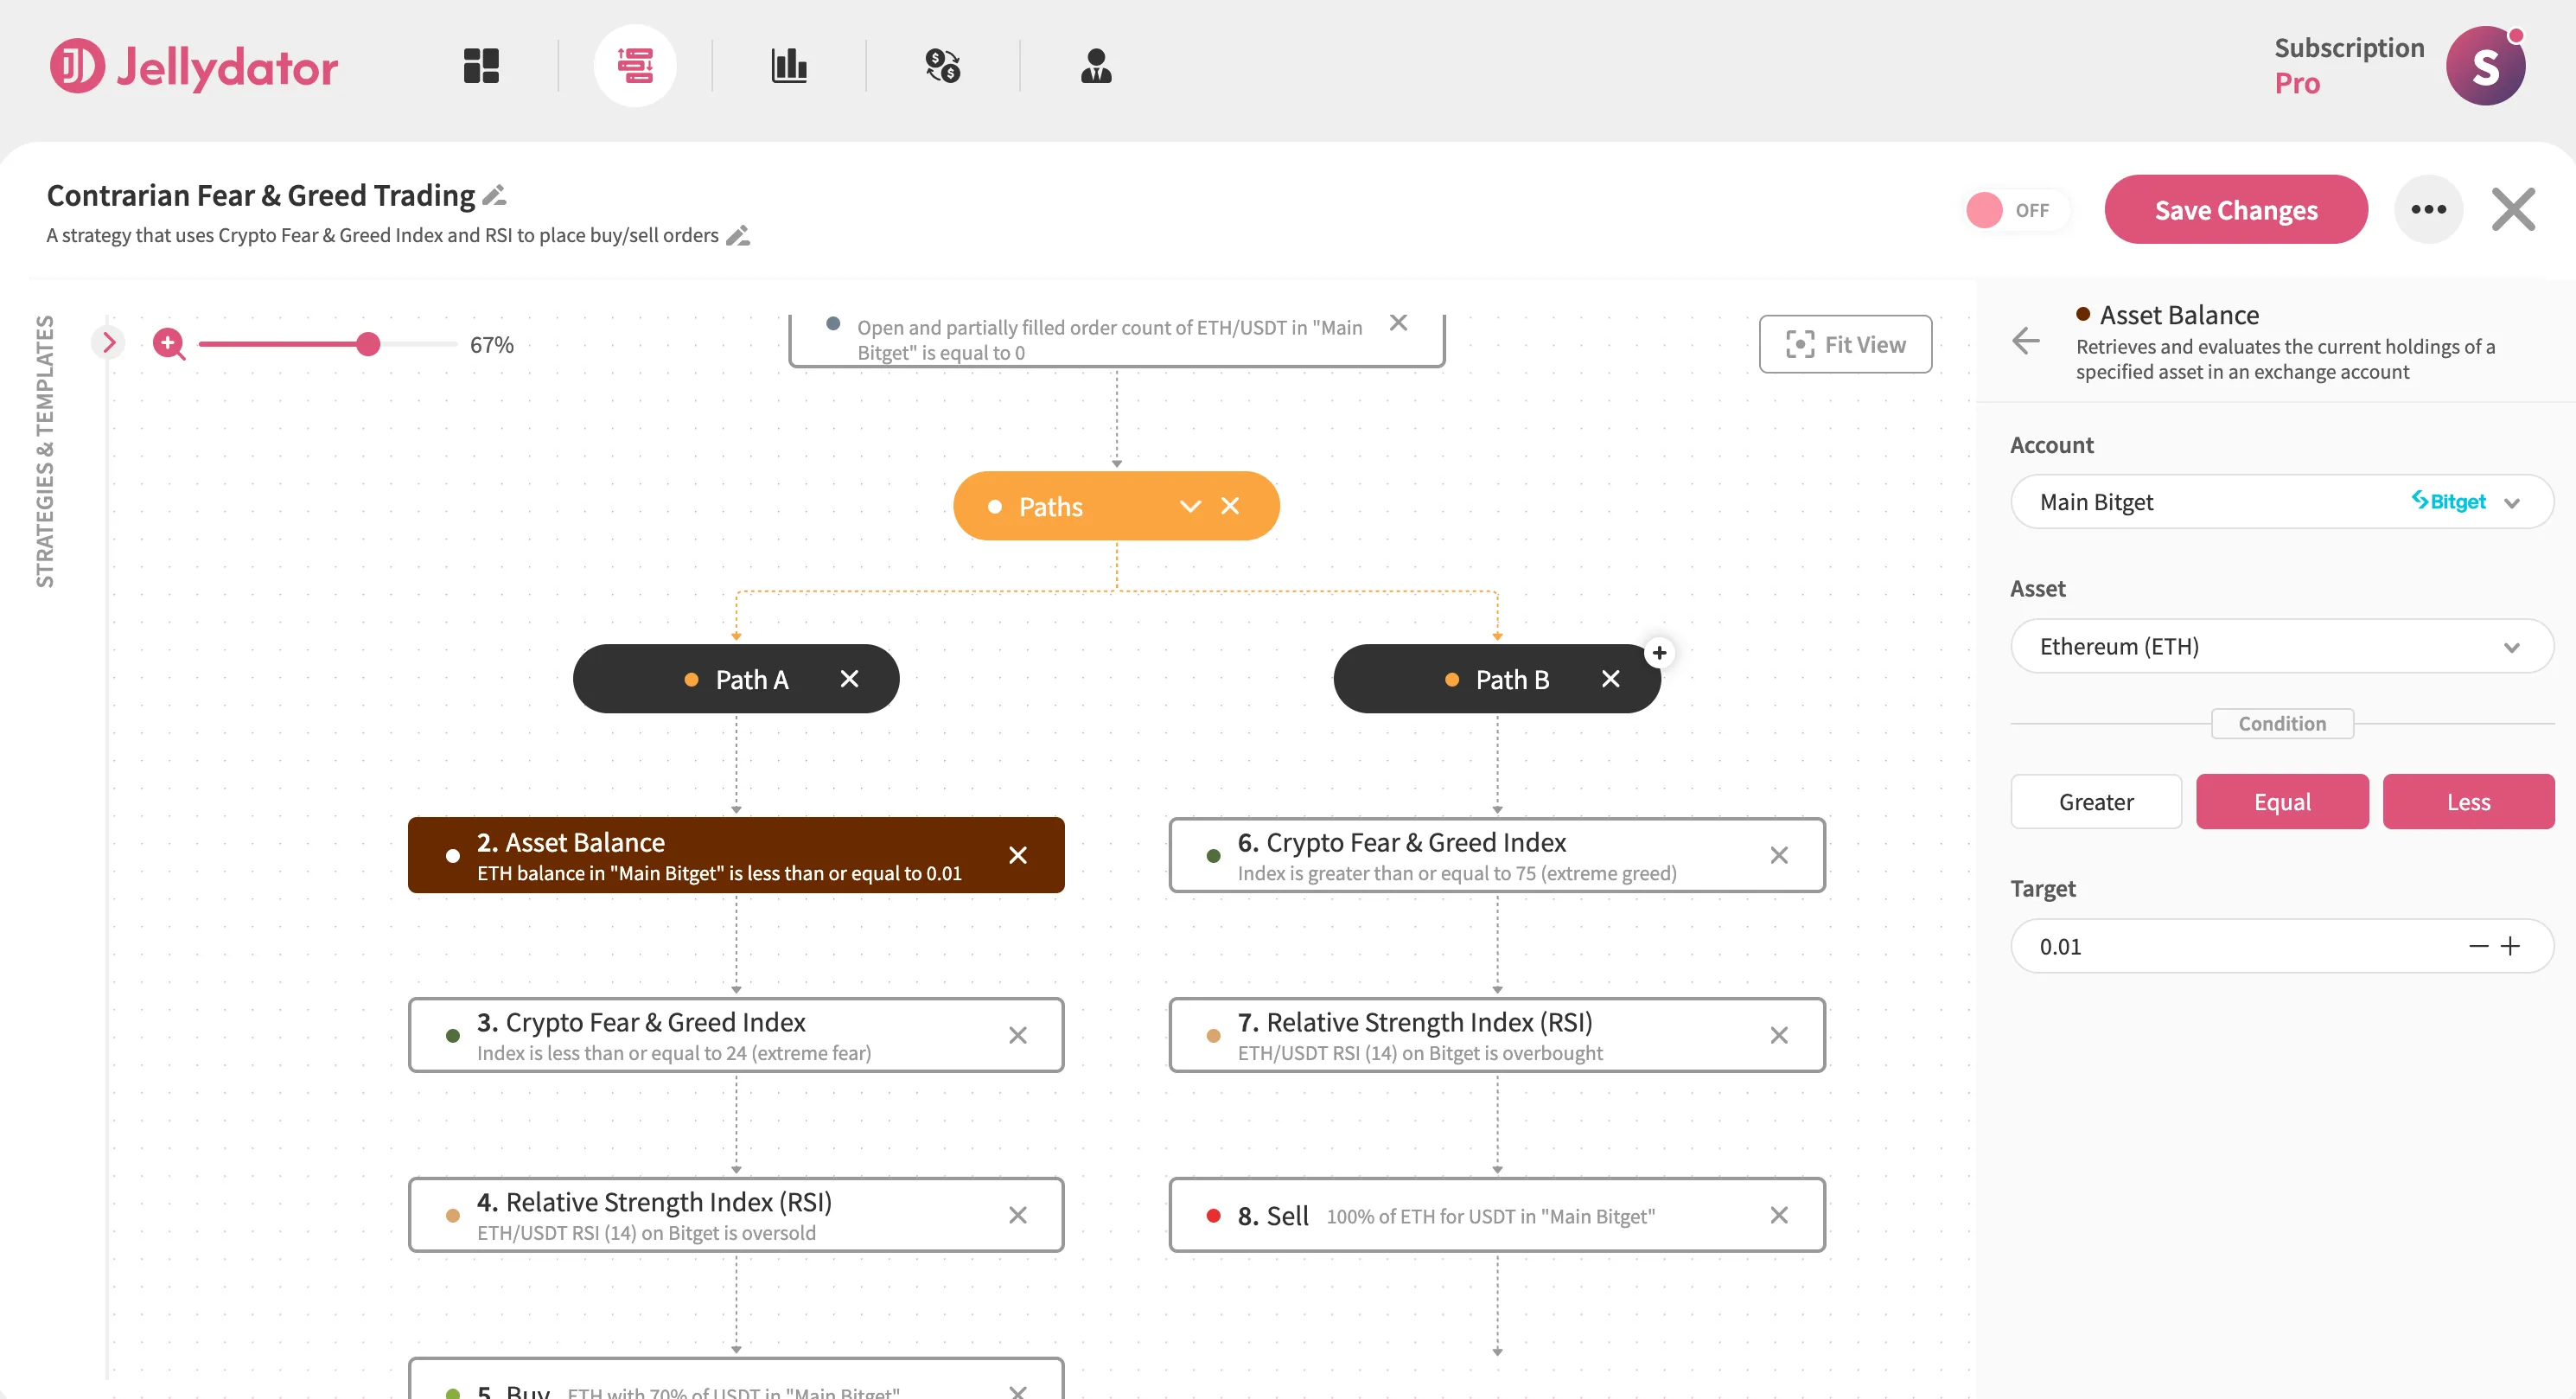
In Path B, add another Asset Balance step for ETH with “Greater Than” the same threshold. This ensures you only sell when holding a tradable quantity. Together, these steps maintain clean position management across both entry and exit points.
Stay Informed with Real-Time Alerts
Enhance your strategy by adding Telegram notifications to both paths. In Path A, include a Send Telegram Message step after your buy order. Customize it with a clear buy message like “Buy order placed.”
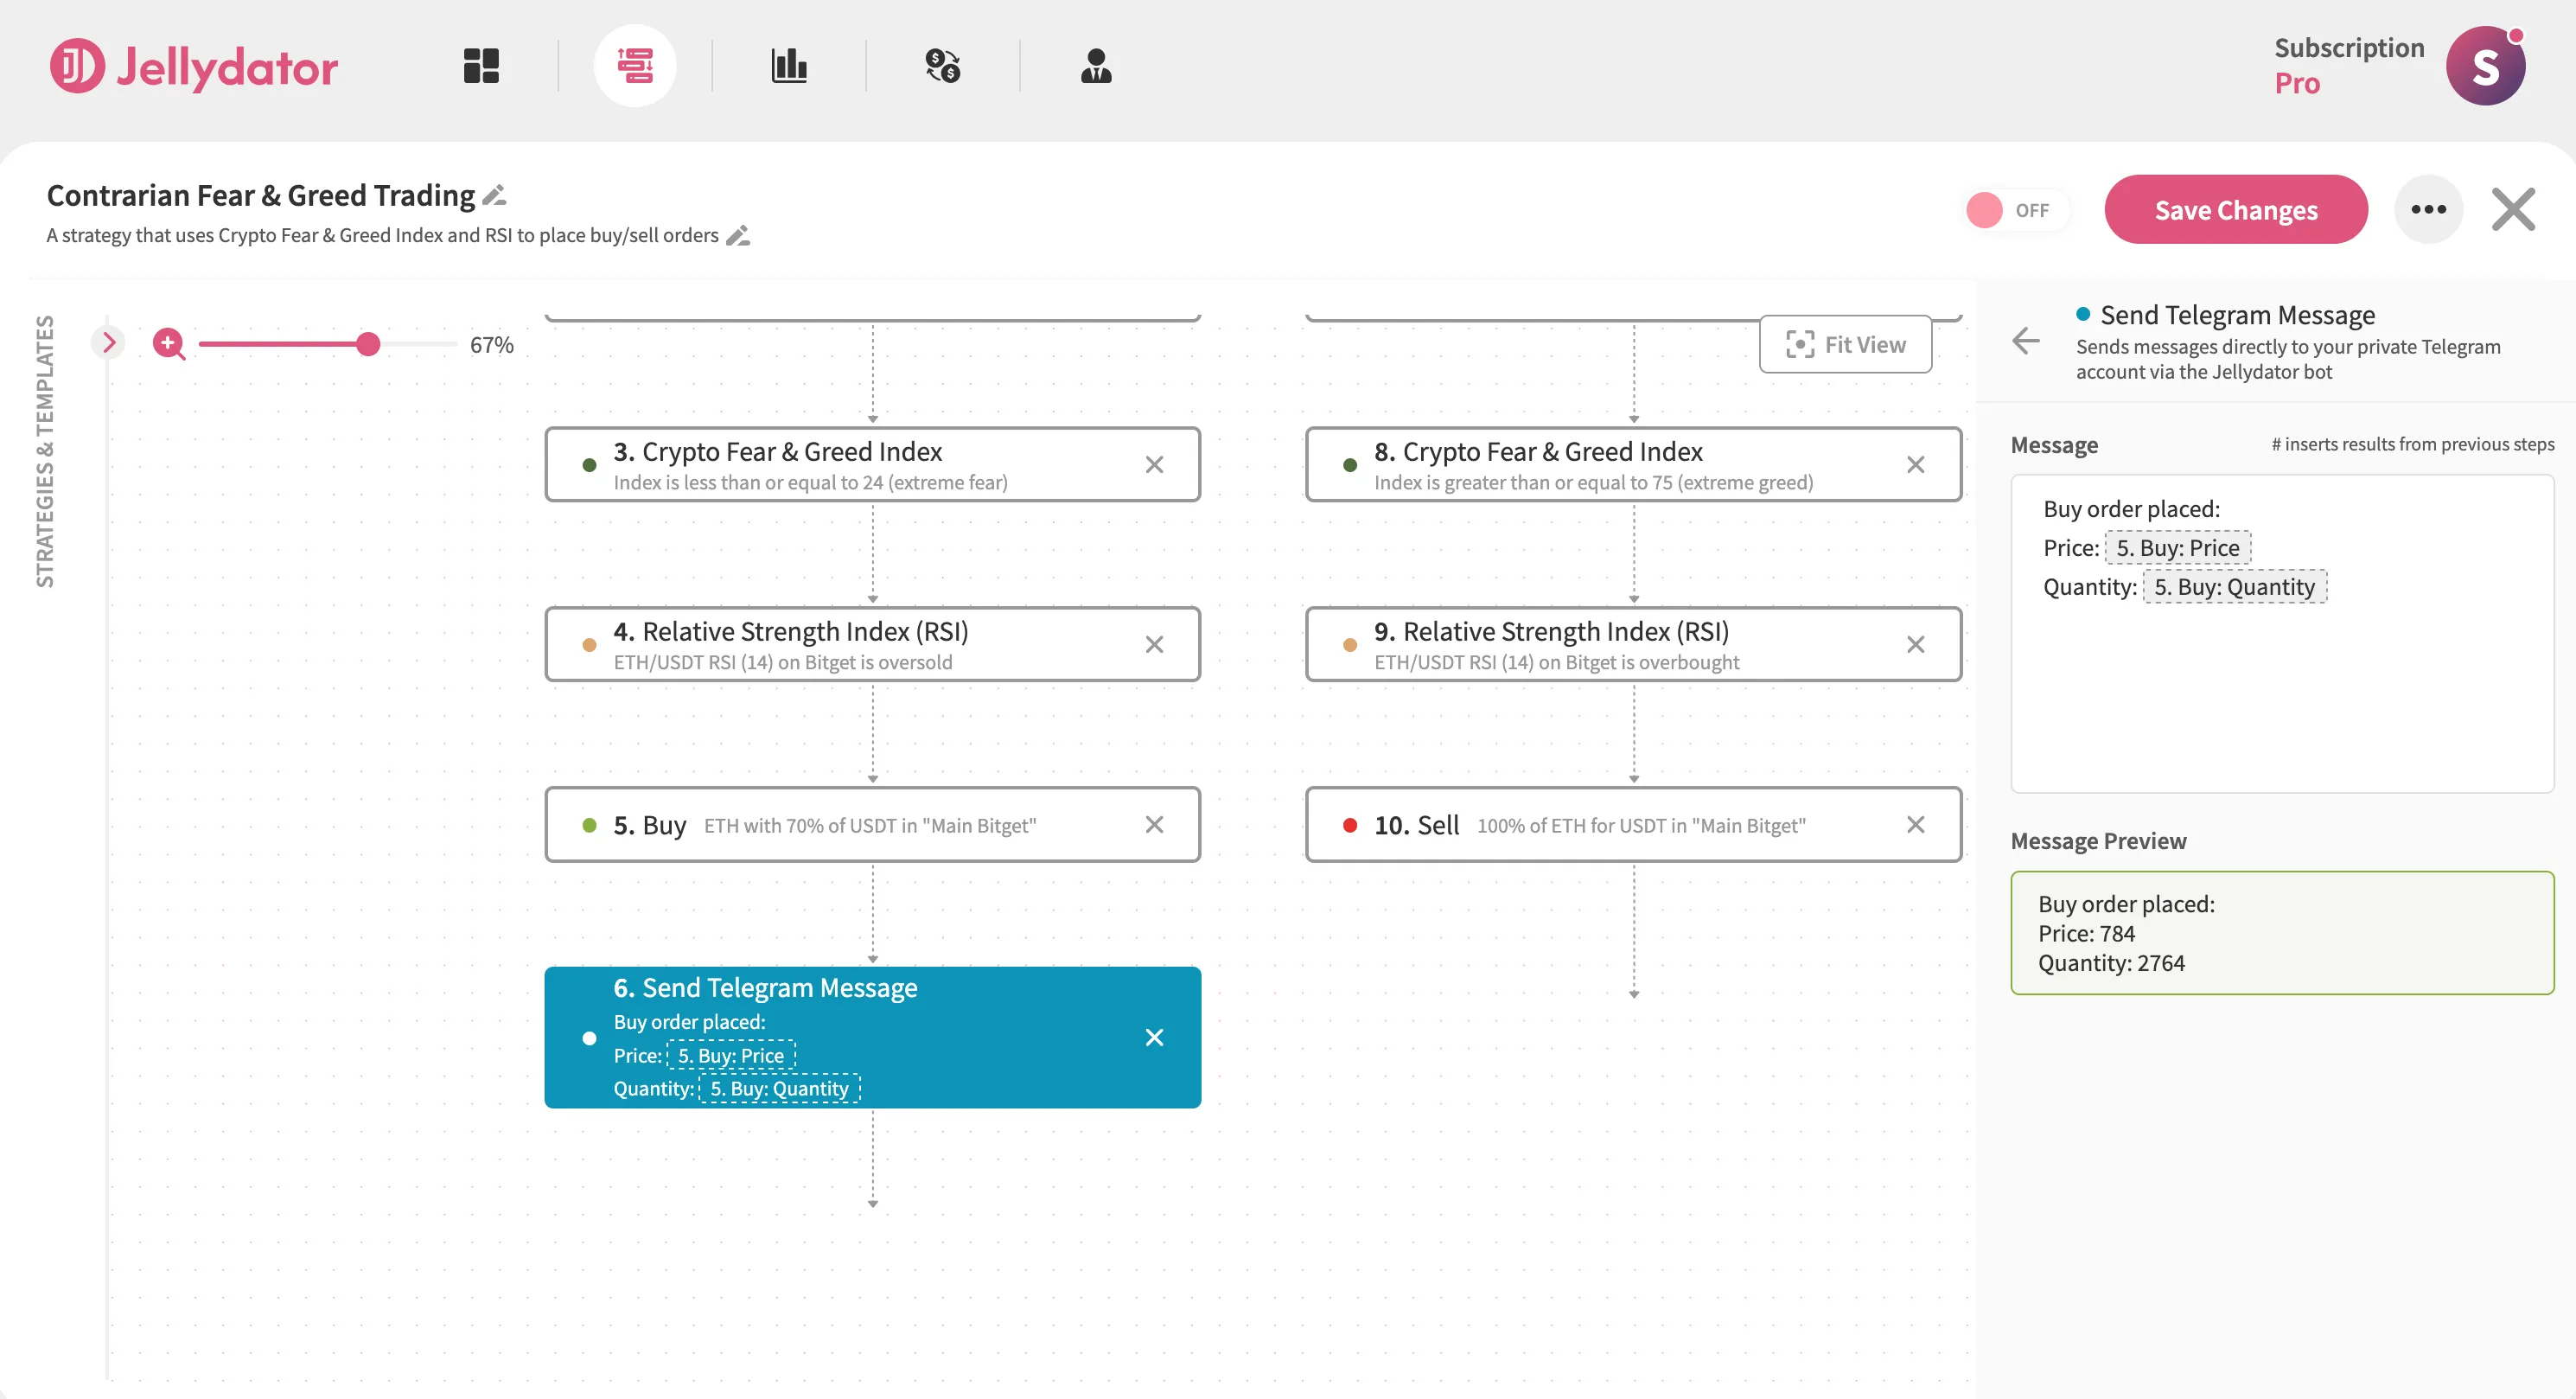
For Path B, place a similar message step after selling, using a phrase such as “Sell order placed.”

Conclusion
With the right tools and a platform that lets you combine them, contrarian trading becomes much more than simply doing the opposite of everyone else. It becomes a thoughtful way to approach the markets. That’s why, in this guide, we combined an indicator that focuses on price movements with the Crypto Fear & Greed Index, which brings in a mix of non-chart data. By using both together, you can filter out false signals and make more confident trading decisions before placing an order.