Explore the World of Jellydator
Discover in-depth tutorials and insightful articles to help you make the most of the Jellydator platform

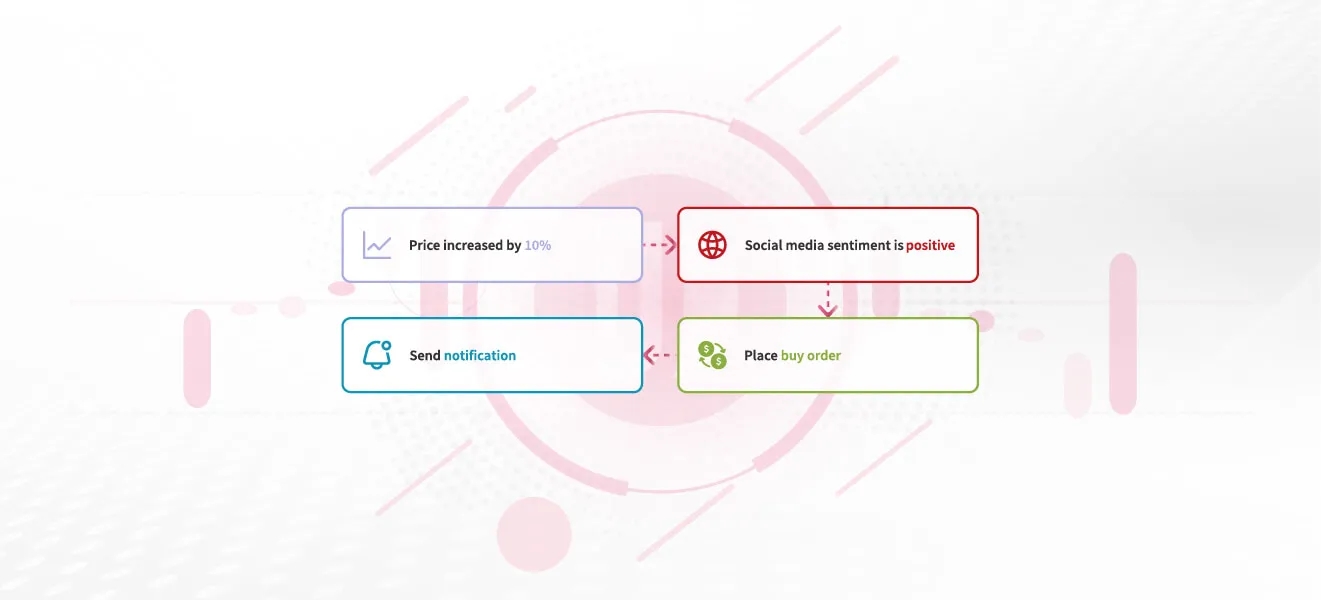
Top 5 Crypto Automation and Trading Bot Use Cases
Discover how crypto automation and trading bots can revolutionize your strategy. Learn five top uses, from technical analysis and sentiment tracking to instant notifications and automated risk controls, for smarter, swifter trades in today’s fast-paced crypto market.

The Problem with Automated Trading Bots
Trading bots aren’t money machines. This blog explains their real role as decision-making helpers, warns against unrealistic promises, and highlights the importance of control and caution in automated trading.

Crypto Trading Bots Are Getting Smarter — Here’s What’s Changing
Crypto trading bots are advancing, but success depends on more than automation. This post explains why intuitive design, transparent analytics, and AI-powered insights are crucial — and how Jellydator is setting a new standard for digital asset trading platforms.

Why Traders Fail in Bull & Bear Markets (And How to Succeed)
Bull or bear, markets test traders’ discipline and strategy. Find out why so many fail, the psychological traps to avoid, and how you can prepare for success in any market environment.

How to Build a Crypto Trading Bot That Works
Should you code your own trading bot, use an exchange tool, try a third-party platform, or go visual with Jellydator? We compare all four to help you pick the right path for your trading automation journey.

Google Trends & Crypto FOMO: Identifying Buying Pressure Through Search Data
Explore the connection between Google Trends and cryptocurrency prices. Learn how search interest impacts market sentiment, discover time-lag patterns, and implement automated strategies with Jellydator to stay ahead in the dynamic world of cryptocurrency trading.

Dollar-Cost Averaging (DCA) in Crypto: A Strategy for Volatile Times
Is Dollar-Cost Averaging (DCA) the best way to invest in crypto? Find out how it works, why it’s popular, and how tools like Jellydator enhance this strategy with advanced flexibility.

The Rise of Crypto ETFs: What They Mean for Bitcoin, Ethereum, and You
Crypto ETFs are changing the game! Understand their role in making Bitcoin and Ethereum accessible, driving demand, and stabilizing markets. Learn to track ETF trends with Jellydator to stay ahead in the fast-paced world of crypto investing.

About Us: The Vision and Future of Jellydator
Jellydator was created to bridge gaps in market analysis tools—offering ease of use, diverse integrations, and transparency. Learn how our journey from a pandemic experiment led to innovative solutions empowering traders across crypto markets and beyond.