
Your Shortcut to Battle-Tested Strategies
Deploy sophisticated trading and analysis strategies in minutes. No experience required.
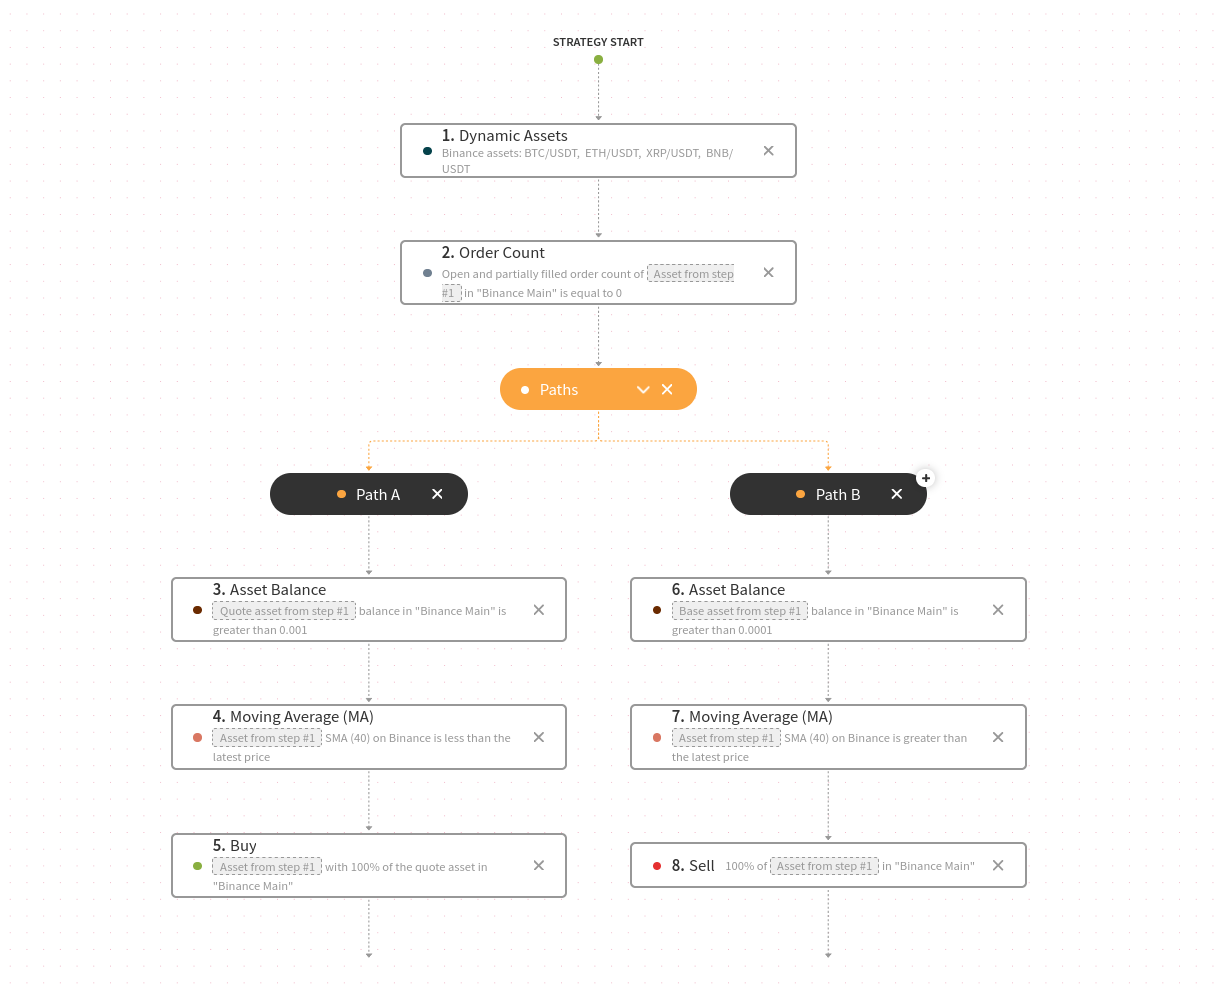
Super Indicator
Sweet Chariot
Opens positions when the price is above the daily 40 SMA and closes them when the price falls below it
MA
Buy
Sell
Balance
Order Count
Dynamic Assets
+2 more
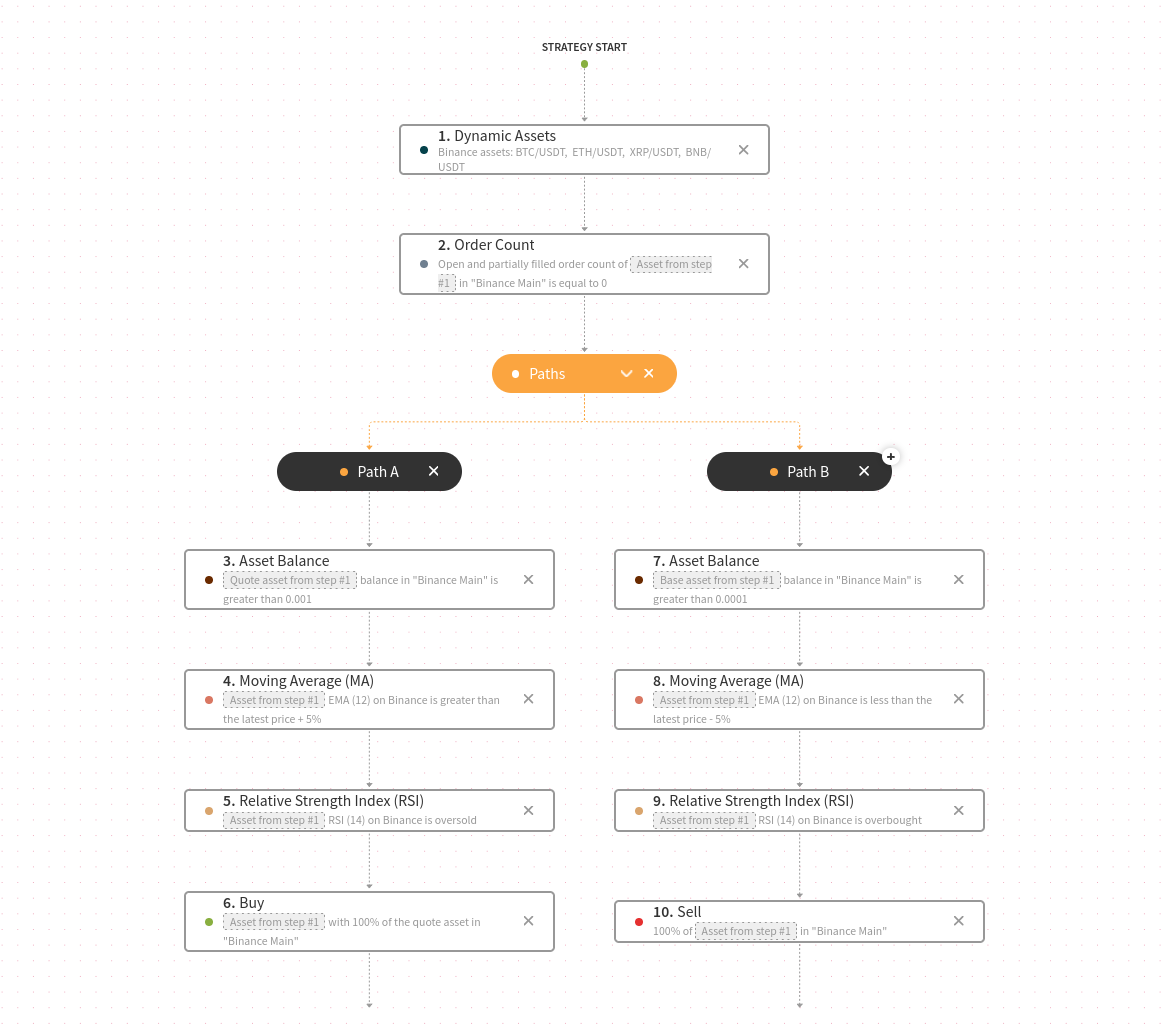
Super Indicator
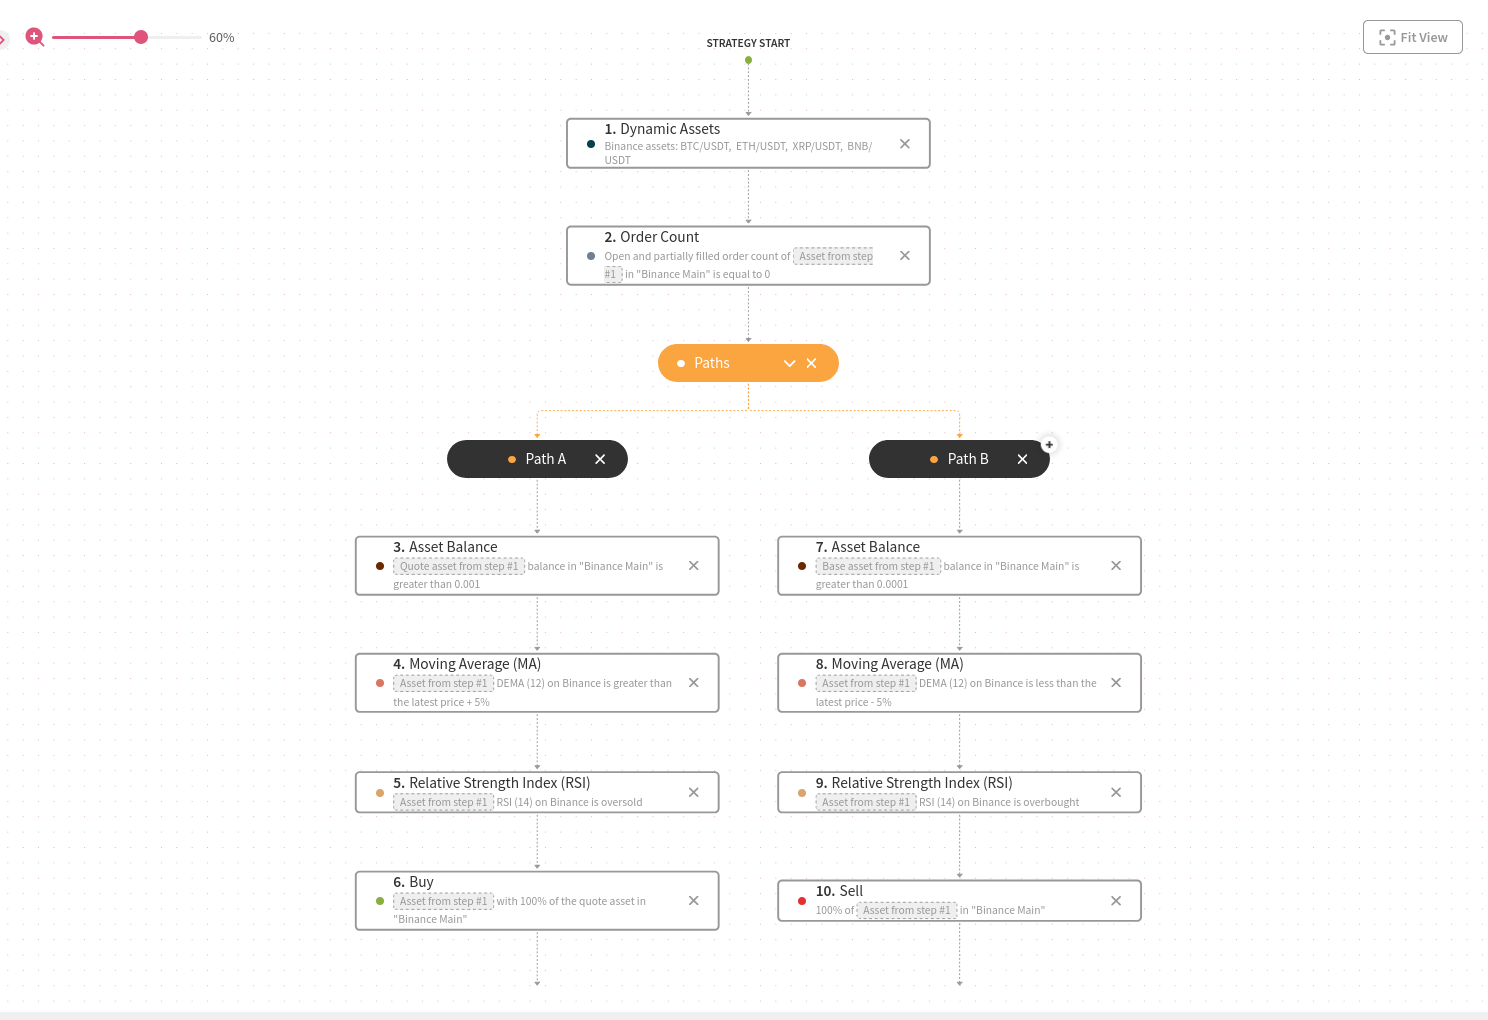
RSI-Enhanced EMA Mean Reversion
Buys when the price falls 5% below the EMA and the RSI is oversold; sells when the price is 5% above the EMA and the RSI is overbought
MA
RSI
Buy
Sell
Balance
Order Count
Dynamic Assets
+3 more
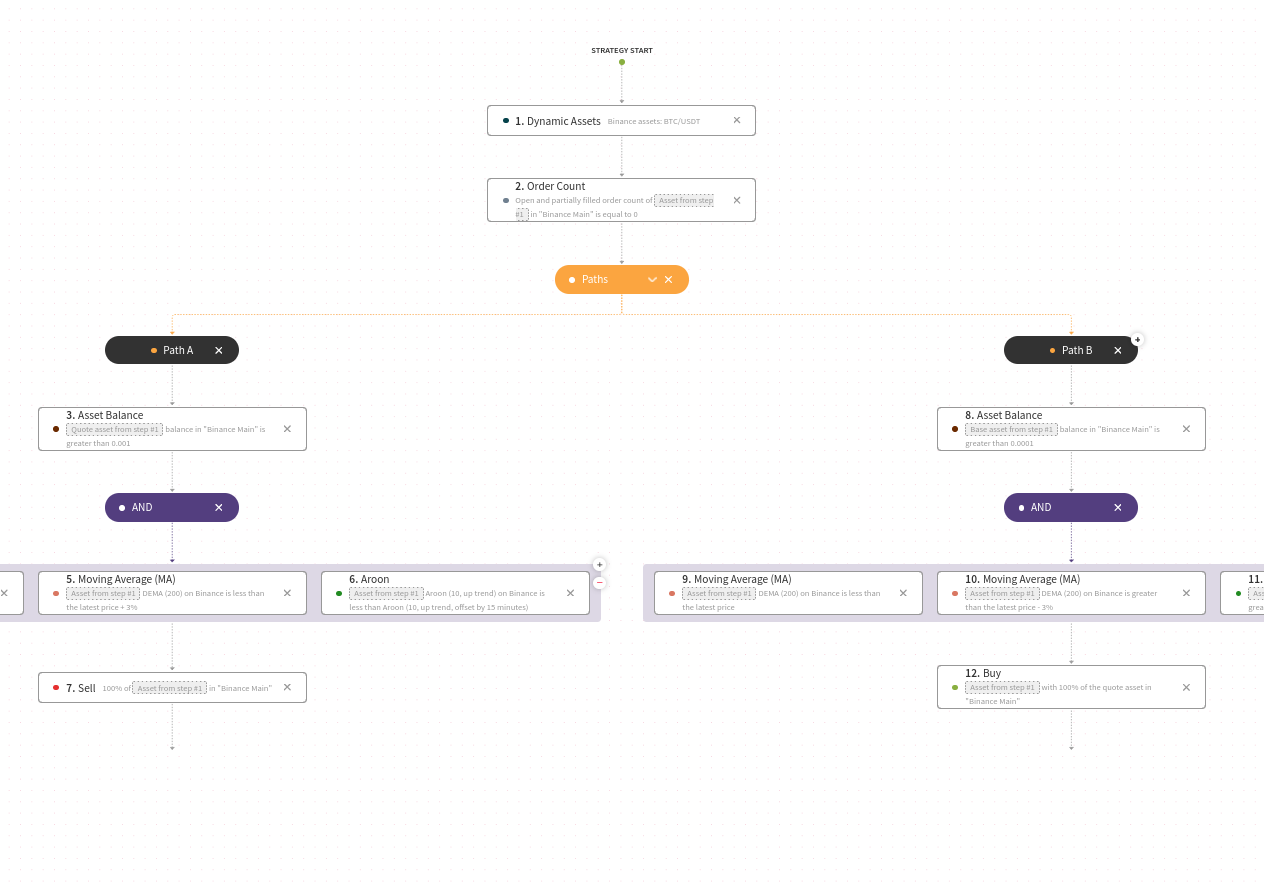
Super Indicator
DEMA Bounce Reversion Play
Uses the slow DEMA as resistance and support; positions are entered and exited when the price nears the moving average
MA
Buy
Sell
Aroon
Balance
Order Count
Dynamic Assets
+5 more
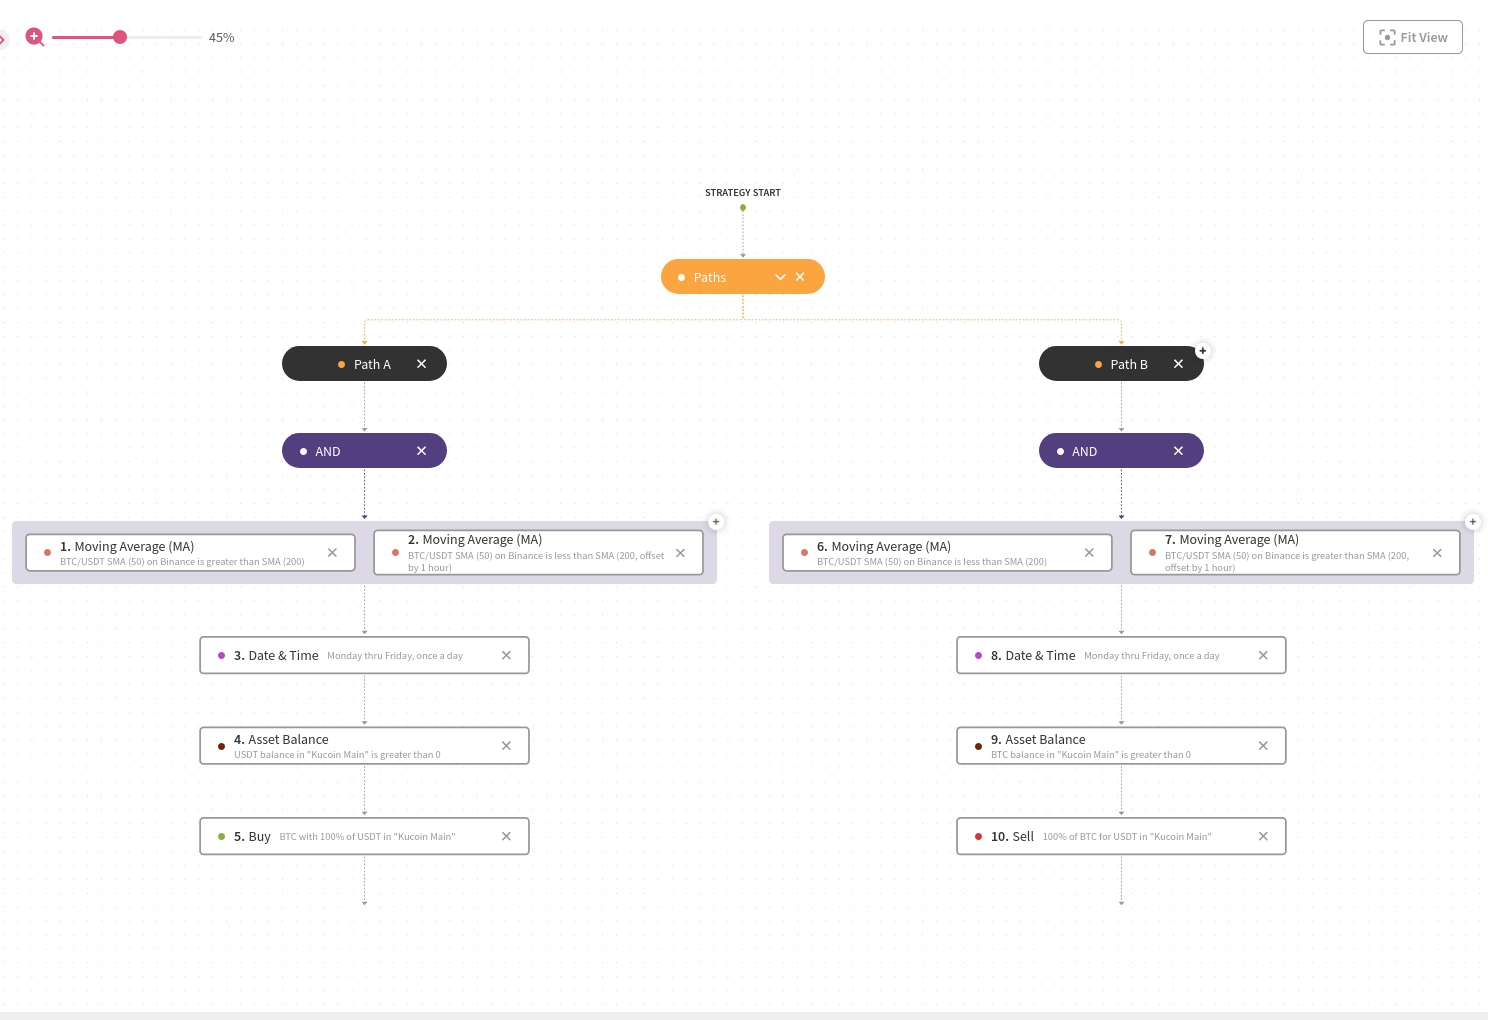
Super Indicator
Golden/Death Cross Reversal
Executes buy orders on a golden cross and sell orders on a death cross
MA
Buy
Time
Sell
Balance
+5 more
Super Indicator
RSI-Enhanced DEMA Mean Reversion
Buys when the price falls 5% below the DEMA and the RSI is oversold; sells when the price is 5% above the DEMA and the RSI is overbought
MA
RSI
Buy
Sell
Balance
Order Count
Dynamic Assets
+3 more
Super Indicator
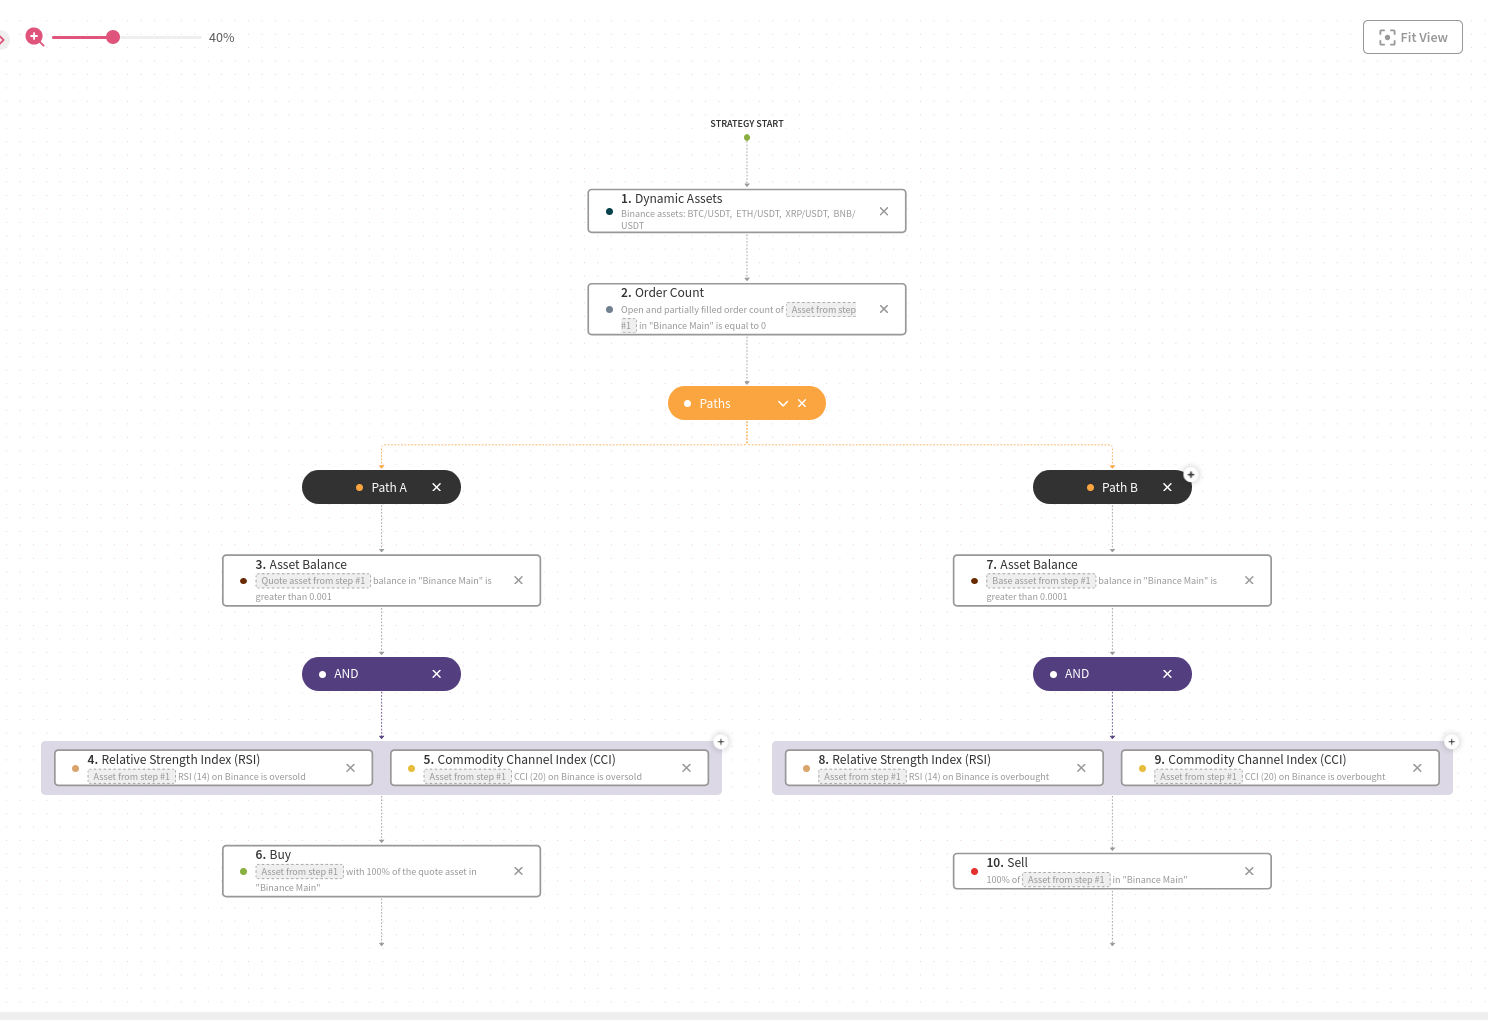
Dual Overbought/Oversold Reversion Confirmation
Uses the RSI and CCI to confirm oversold and overbought conditions
RSI
CCI
Buy
Sell
Balance
Order Count
Dynamic Assets
+3 more
Super Indicator
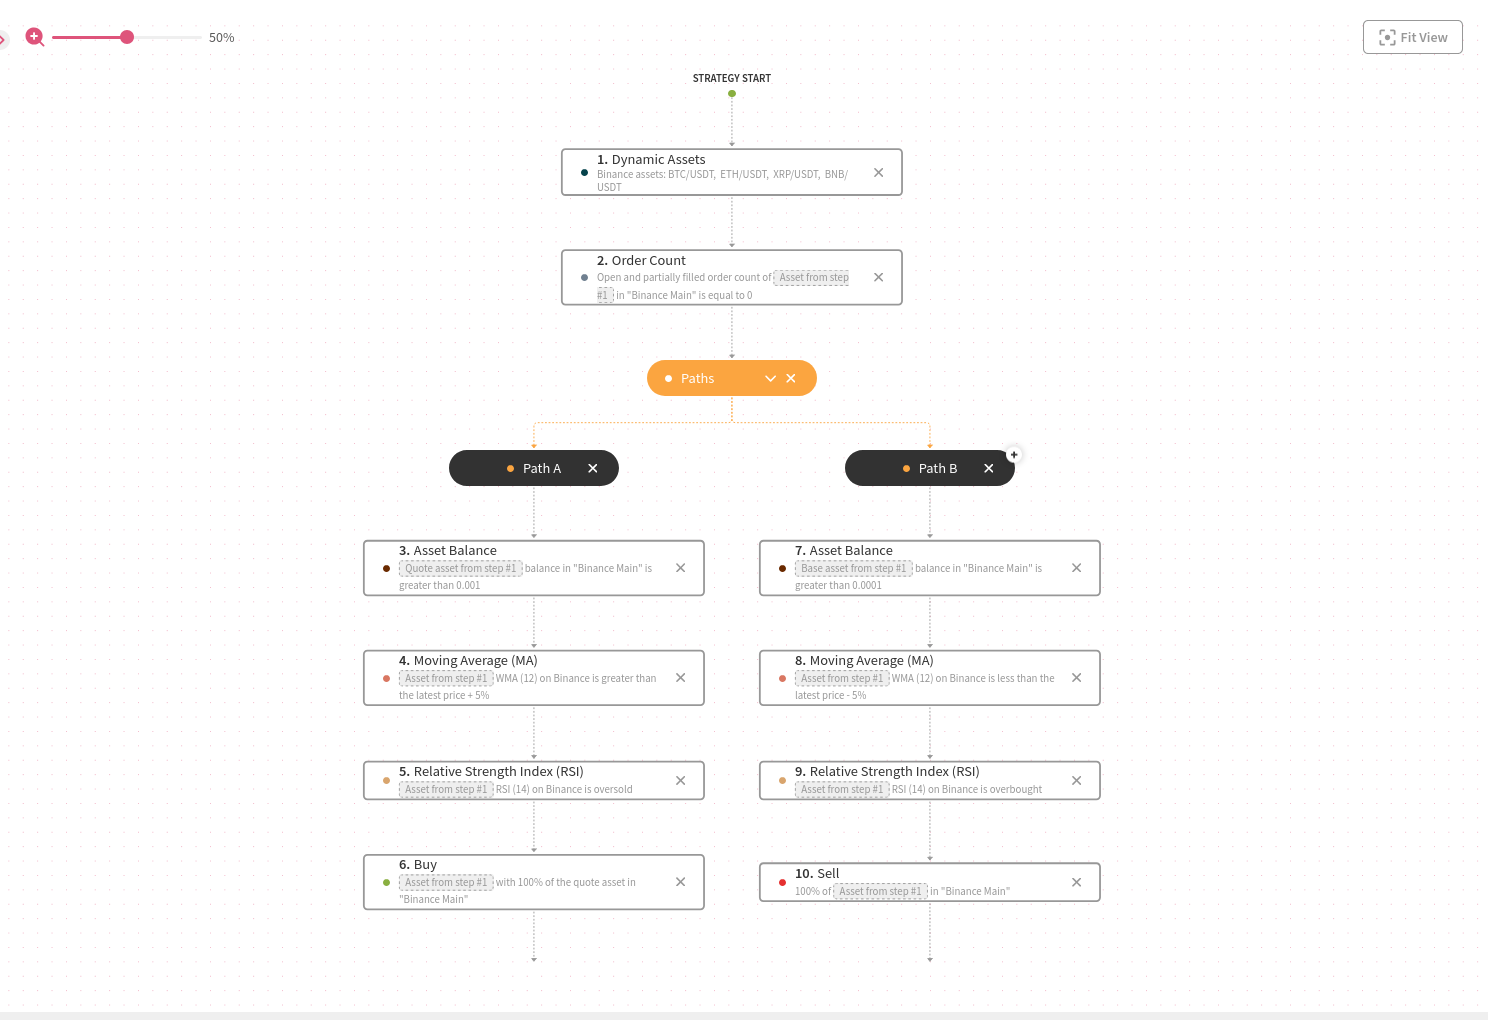
RSI-Enhanced WMA Mean Reversion
Buys when the price falls 5% below the WMA and the RSI is oversold; sells when the price is 5% above the WMA and the RSI is overbought
MA
RSI
Buy
Sell
Balance
Order Count
Dynamic Assets
+3 more
Super Indicator
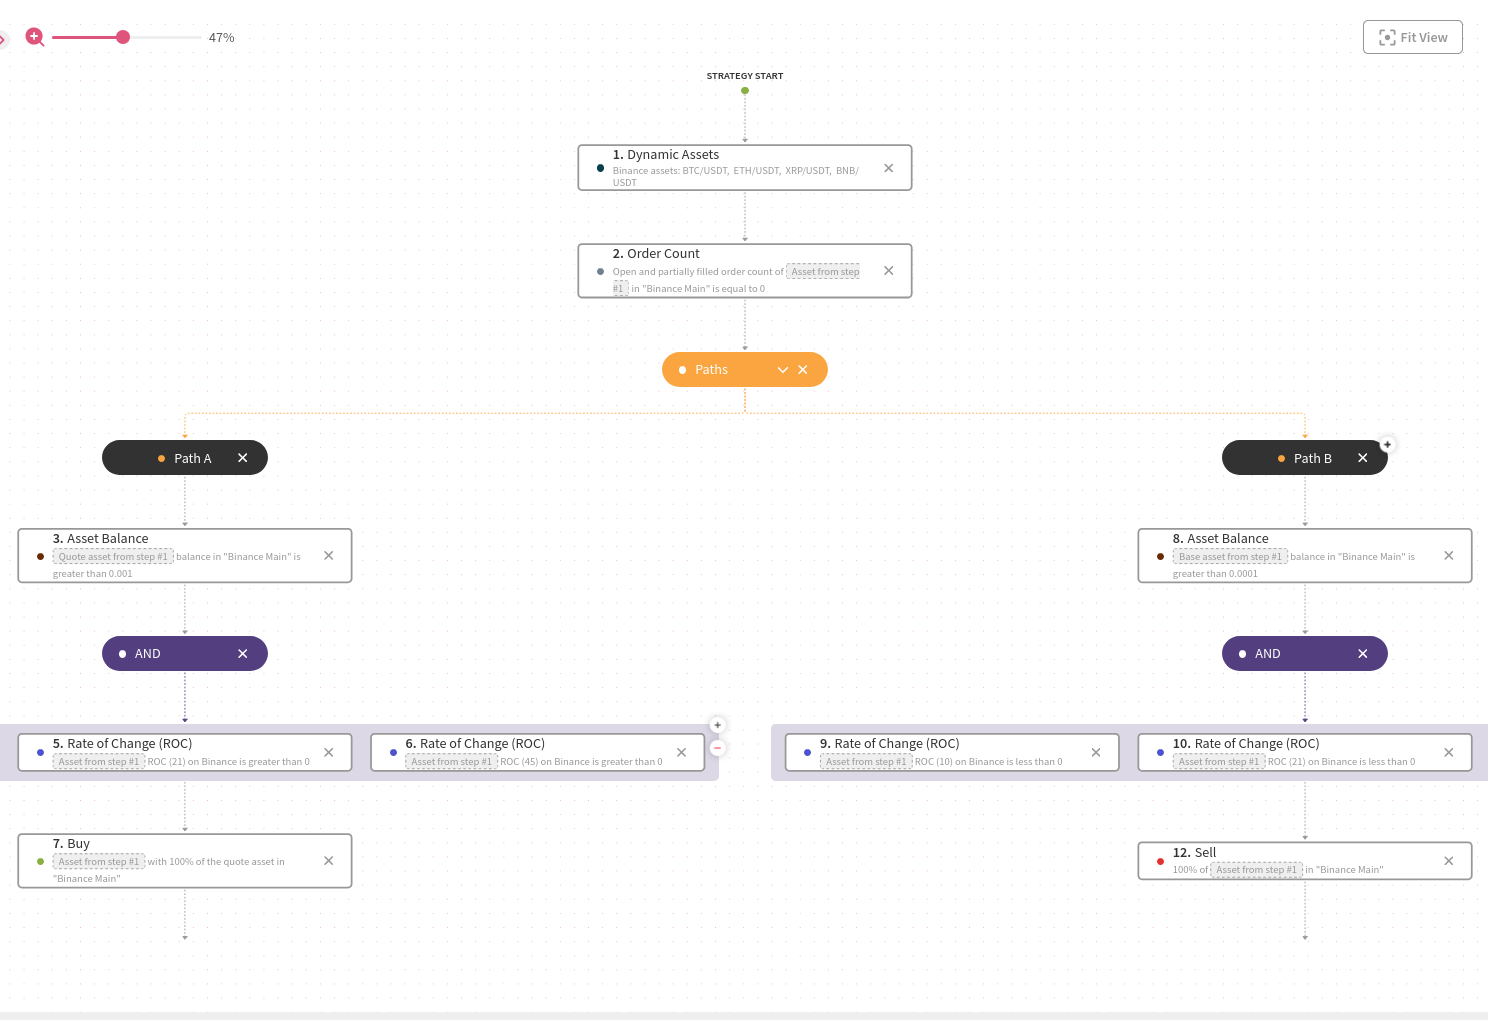
Multi-Timeframe ROC Analysis
Monitors short (10), medium (21), and long (45) ROCs at the zero line to signal strong upward or downward trends
ROC
Buy
Sell
Balance
Order Count
Dynamic Assets
+6 more
Super Indicator
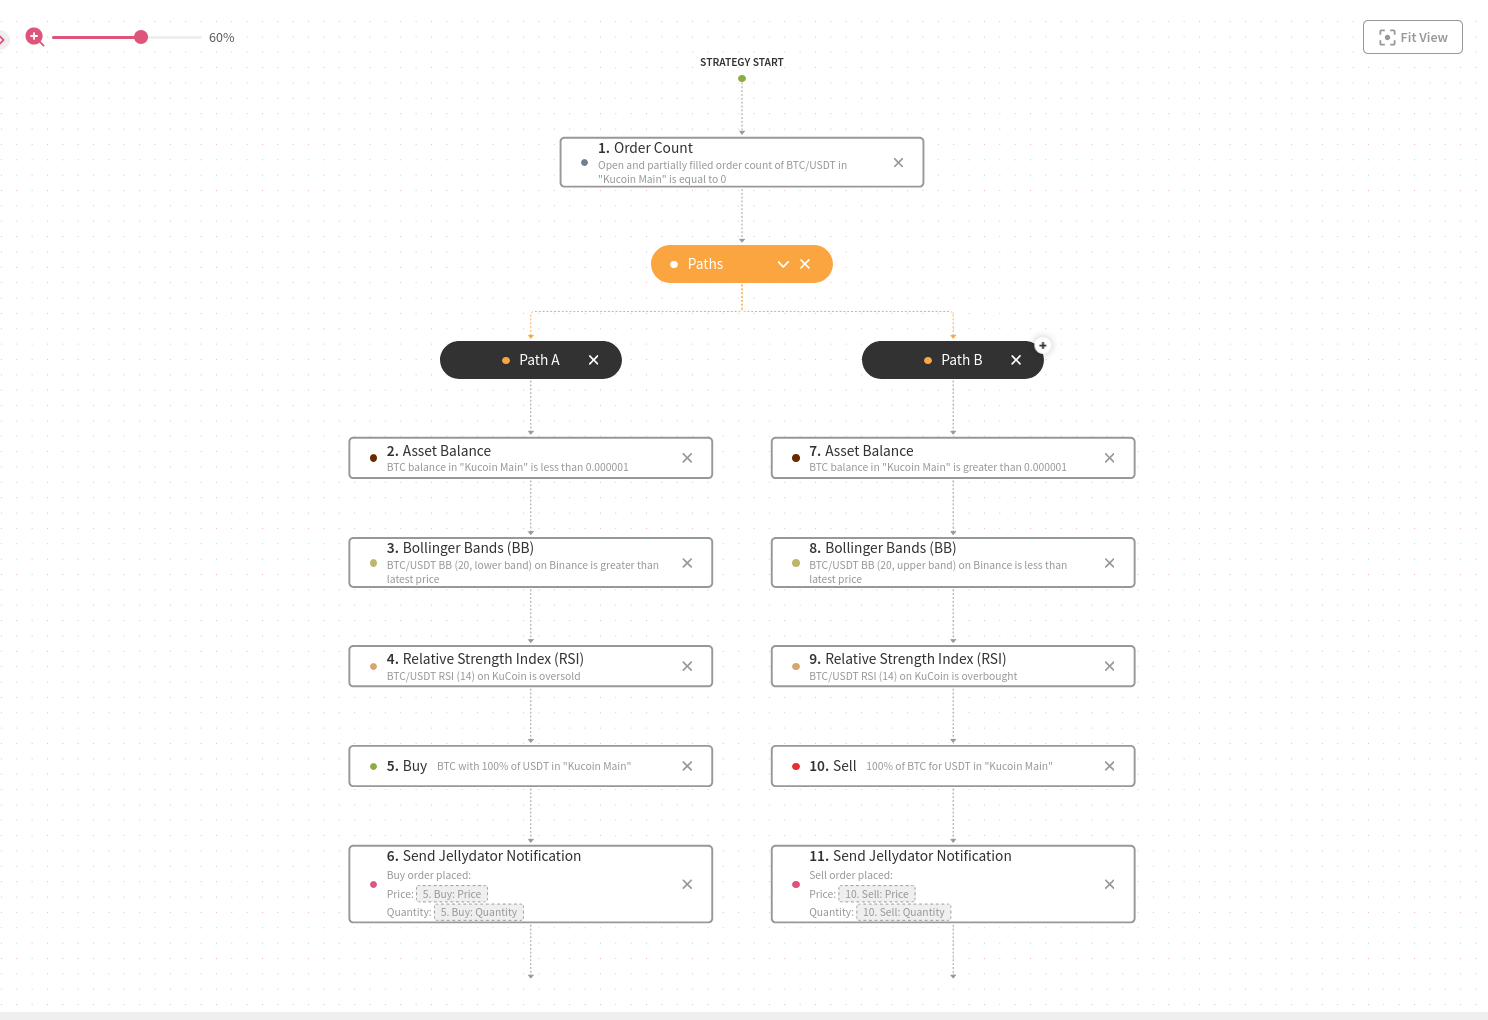
RSI-Enhanced Bollinger Band Reversion
Uses Bollinger Bands and the RSI to decide when to buy or sell
BB
RSI
Buy
Sell
Balance
Order Count
+5 more
Super Indicator
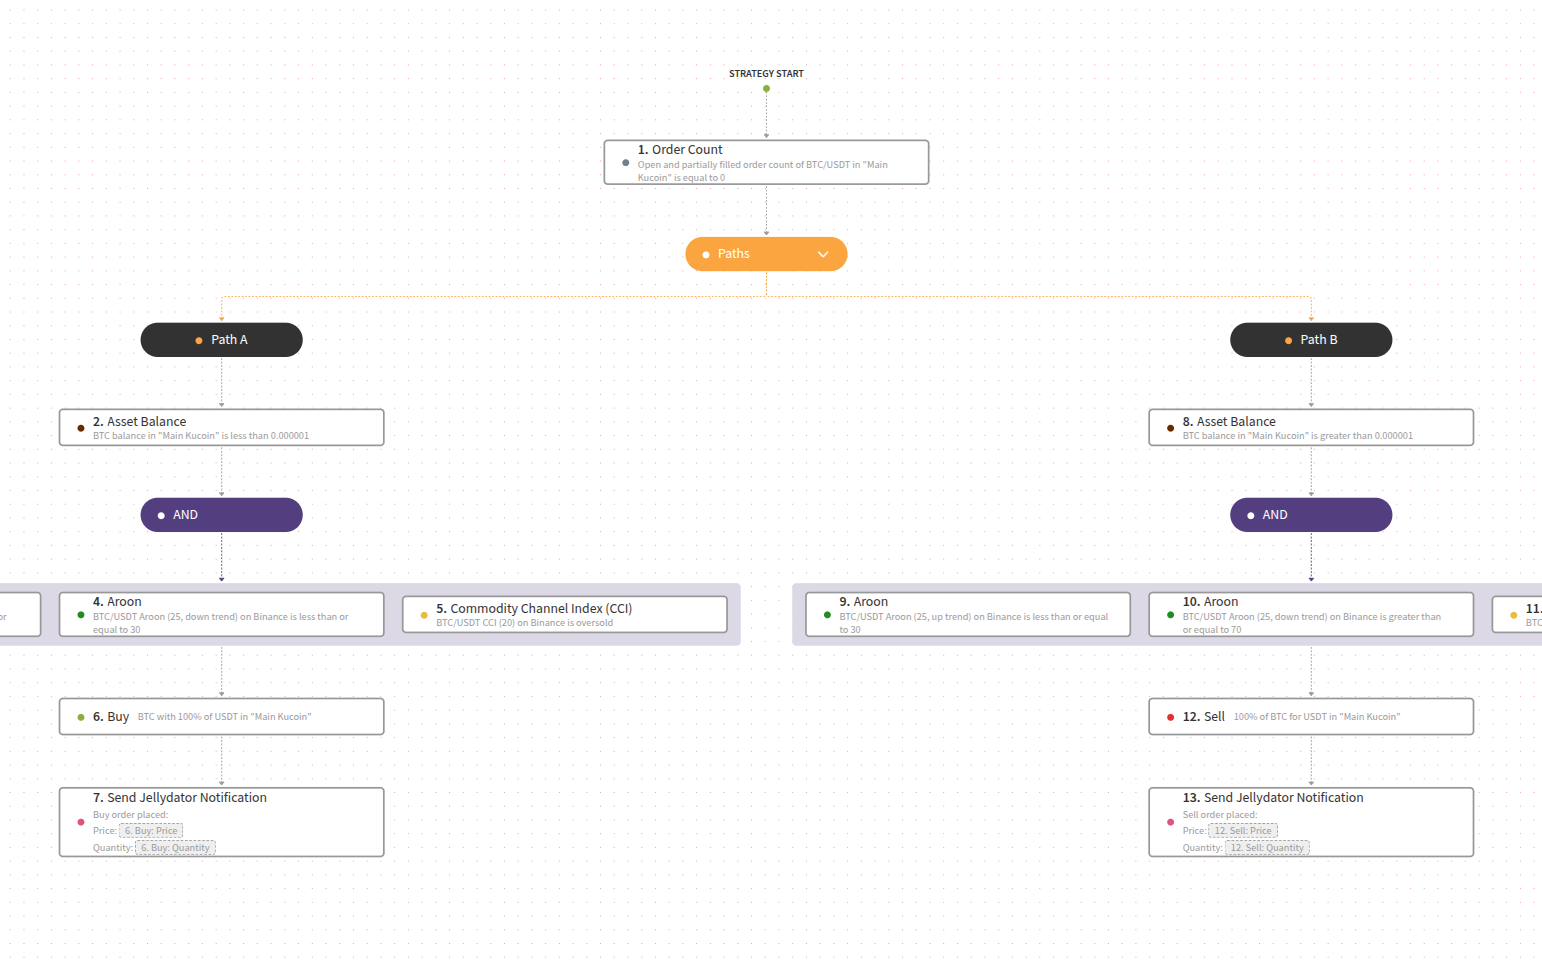
CCI-Enhanced Aroon Bullish & Bearish Reversion
Uses the CCI and Aroon up and down trends to decide when to buy or sell
CCI
Buy
Sell
Aroon
Balance
Order Count
+7 more
Super Indicator
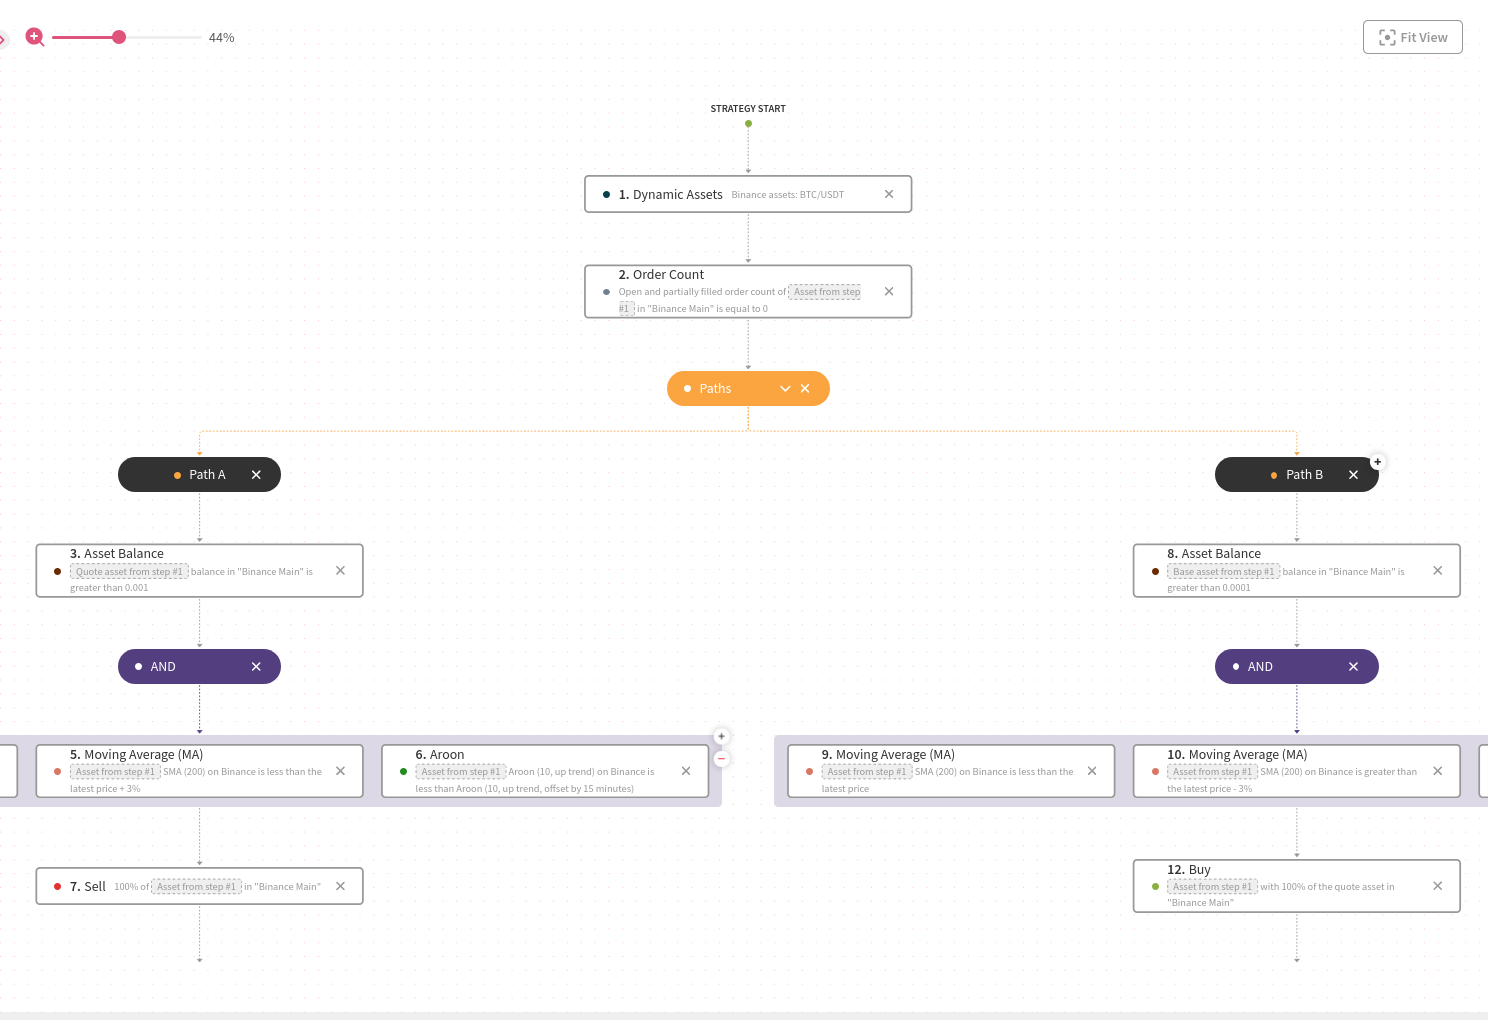
SMA Bounce Reversion Play
Uses the slow SMA as resistance and support; positions are entered and exited when the price nears the moving average
MA
Buy
Sell
Aroon
Balance
Order Count
Dynamic Assets
+5 more
Super Indicator
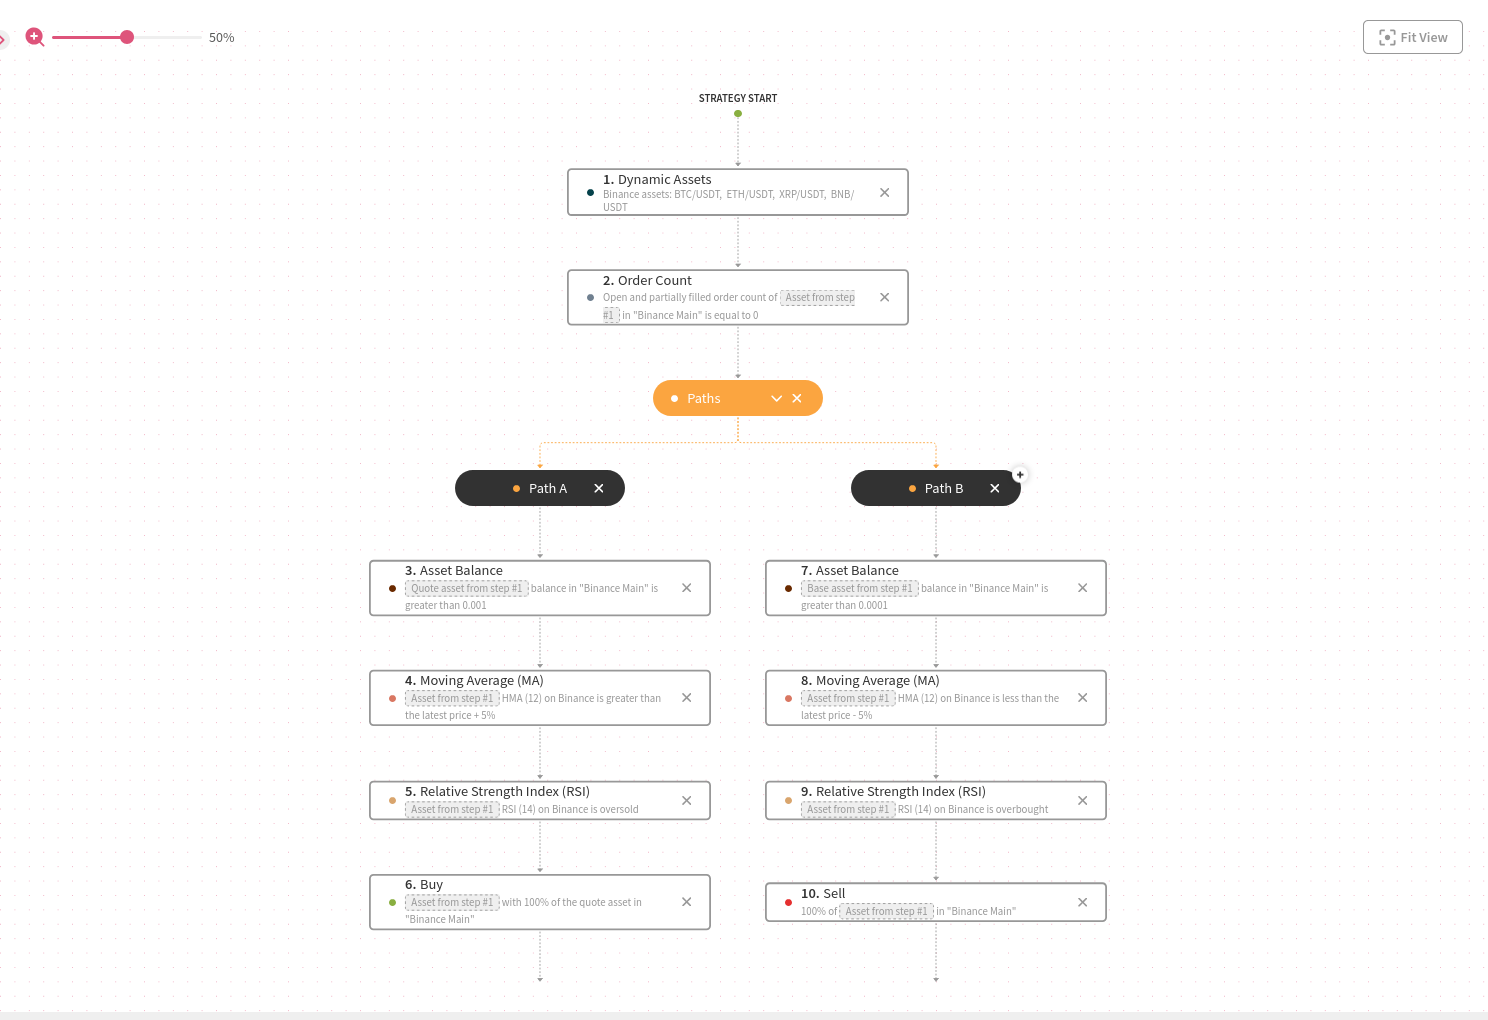
RSI-Enhanced HMA Mean Reversion
Buy when price falls 5% below HMA and RSI is oversold, sell when price is 5% above HMA and RSI is overbought
MA
RSI
Buy
Sell
Balance
Order Count
Dynamic Assets
+3 more
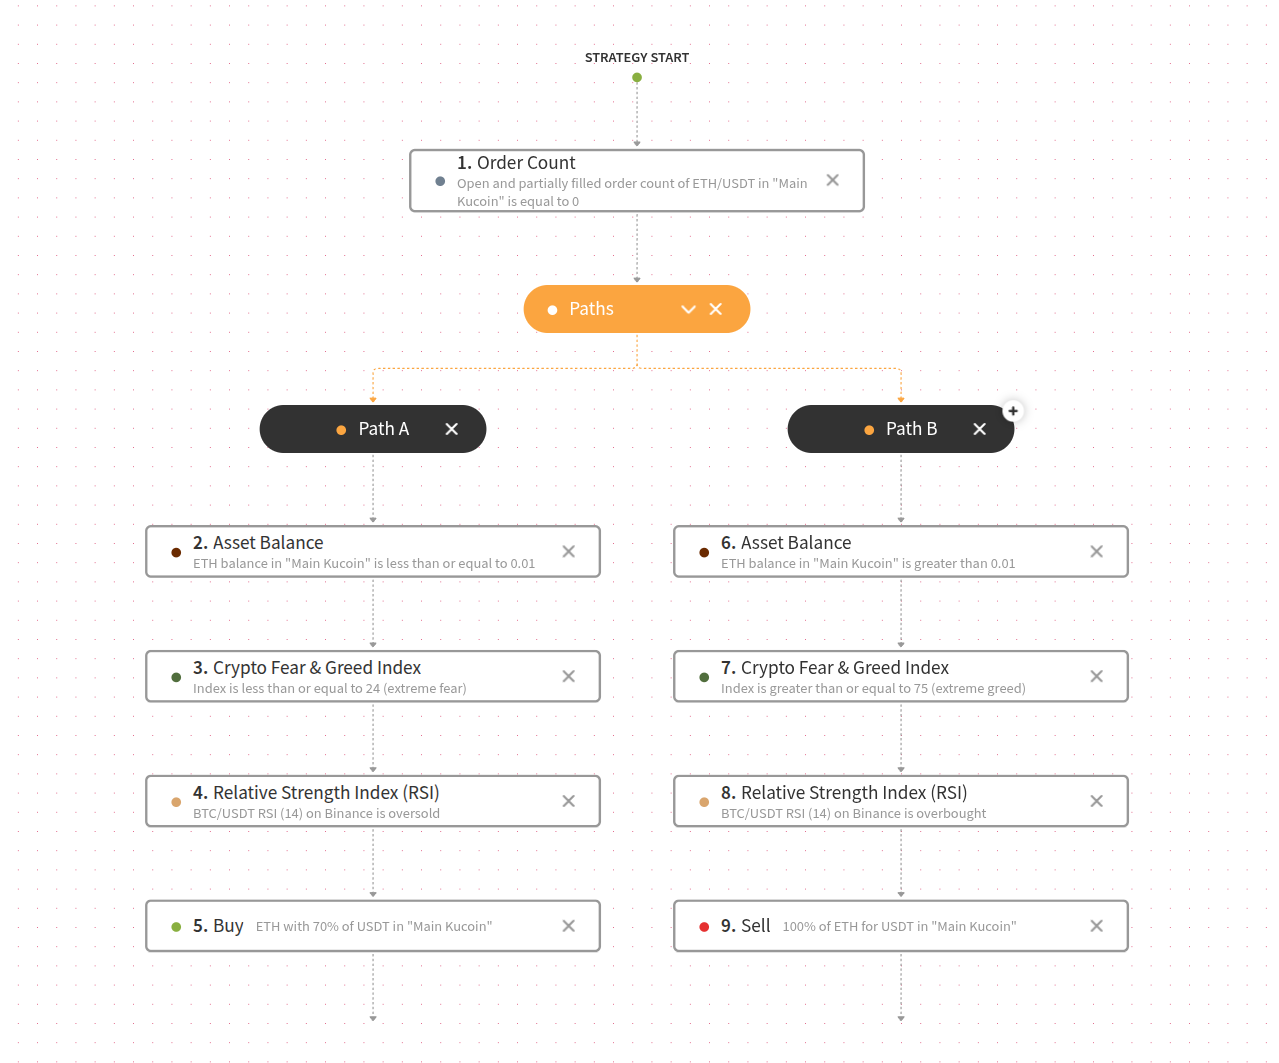
Super Indicator
Contrarian Fear & Greed + RSI Trading
Uses the Crypto Fear & Greed Index and RSI to place buy and sell orders
RSI
Buy
Sell
Balance
Order Count
Fear & Greed
+3 more